Using SQL-modeling to tell different stories about user behavior
A bit over 7 months ago, Jules (our Head of Data Analysis and Conversion Optimization) sent me a message in Slack letting me know that he just published a blog post: “Session modeling in BigQuery SQL“. It’s a really fine post, and I recommend that you take an extra few minutes to go over to his blog to read it.
His post explains how you can create your own session logic in SQL, something that is particularly relevant for all of the people out there who are going to start drinking the BigQuery Kool-Aid now that GA4 has an export that is available to all without needing to be a GA360 owner.
But why does this matter? Why would someone want to create their own definition of a session?
Conceptually, the session in Digital Analytics it is meant to provide a contextual understanding of the raw clickstream data that gets collected by the analytics tool and make it more understandable. The term session is synonymous with a “visit”. We want to know what happens when someone “visits” our site.
Yet, the definition that defines a visit in most of our tools is fairly arbitrary. Here is a link to GA’s session definition. Of course, the definition is malleable and is something that can be altered within Admin Settings (not retroactively, of course). And, of course, GA4 (currently) only uses time based expiration for sessionization. #eeks. It seems like we’re already having some trouble with determining what constitutes a “visit”.
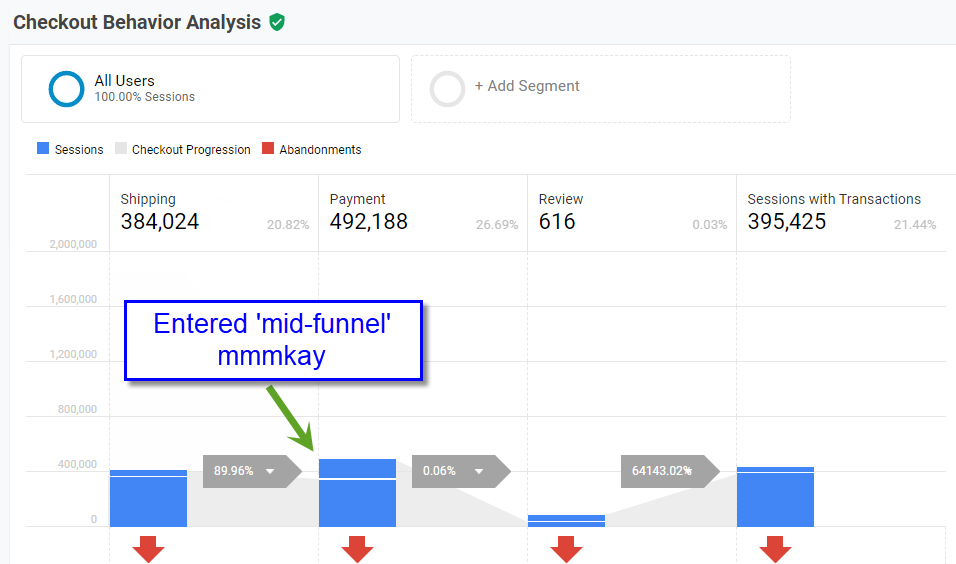
To illustrate this, here is one of the most common reports where the scourge of sessionization rears its ugly head is the Checkout Behavior Analytics report.
All of those “entrances” in mid-funnel step are due to session timeout. Have you ever had a Landing Page report showing an awesome conversion rate for the /cart or /checkout page? Yah. Because the user really “landed” there…
Jules and I are not alone in wanting more from our analytics… In a particularly “dramatically worded” blog post, Simo Ahava railed against what he calls the Schema Conspiracy.
In his words:
Think of it like this. You might need 14 sessions to convert when buying a new boat. You might need only 6 sessions to convert when buying a new computer. But in the end you’re still just one user that converted, regardless of the number of sessions it took to do so. The key here is that you had a singular intent: to buy a boat or a new computer. This intent spanned a number of sessions, highlighting the disconnect between sessions and behavior even more.
In response, Carmen Mardiros (a super smart, senior analytics practitioner) replied in the comments:
I fully agree Simo. What you say makes perfect sense. If we did have access to hit level data (which is the easy part) we could define, for example, a shopping session based on the intent footprint. But that kind of custom definition of a session, even though it more accurately reflects reality, would be very difficult to do. For example, how do you infer, based on data that someone has migrated from “window shopping” to “actively shopping”? Adding to basket is an ambiguous event in terms of intent.
But I get what you’re saying, it’s about becoming aware of the limitations of the current schema and working through the business logic that can reflect more accurately the business itself.
In true Carmen fashion, the use case that she suggested for understanding intent (moving from window shopping to actively shopping) is ‘very difficult’ to do. And for Carmen to call something ‘very difficult’, is like me eating some food and calling it ‘very spicy’.
Nevertheless, though it may be difficult to build one’s own schema based upon different indications of behavioral intent, let me wrap up this first half of the post with Jules’ words:
The trick in SQL-session modeling is to decide two things
- what events to include
- what event ends a session
“Tries” and “Journeys”
One thing that Jules did not mention in his post, is that he built two different models in the recent past for our clients that directly addressed their business needs because GA’s models just didn’t cut it for them. Instead of using the term “sessions” to define our custom schemas, we came up with our own nicknames. I’ll now explain a bit how both of these models work.
Tries
The idea behind “tries” is quite interesting, and anyone who works with Product Analytics will probably clap their hands as soon as the concept clicks for them.
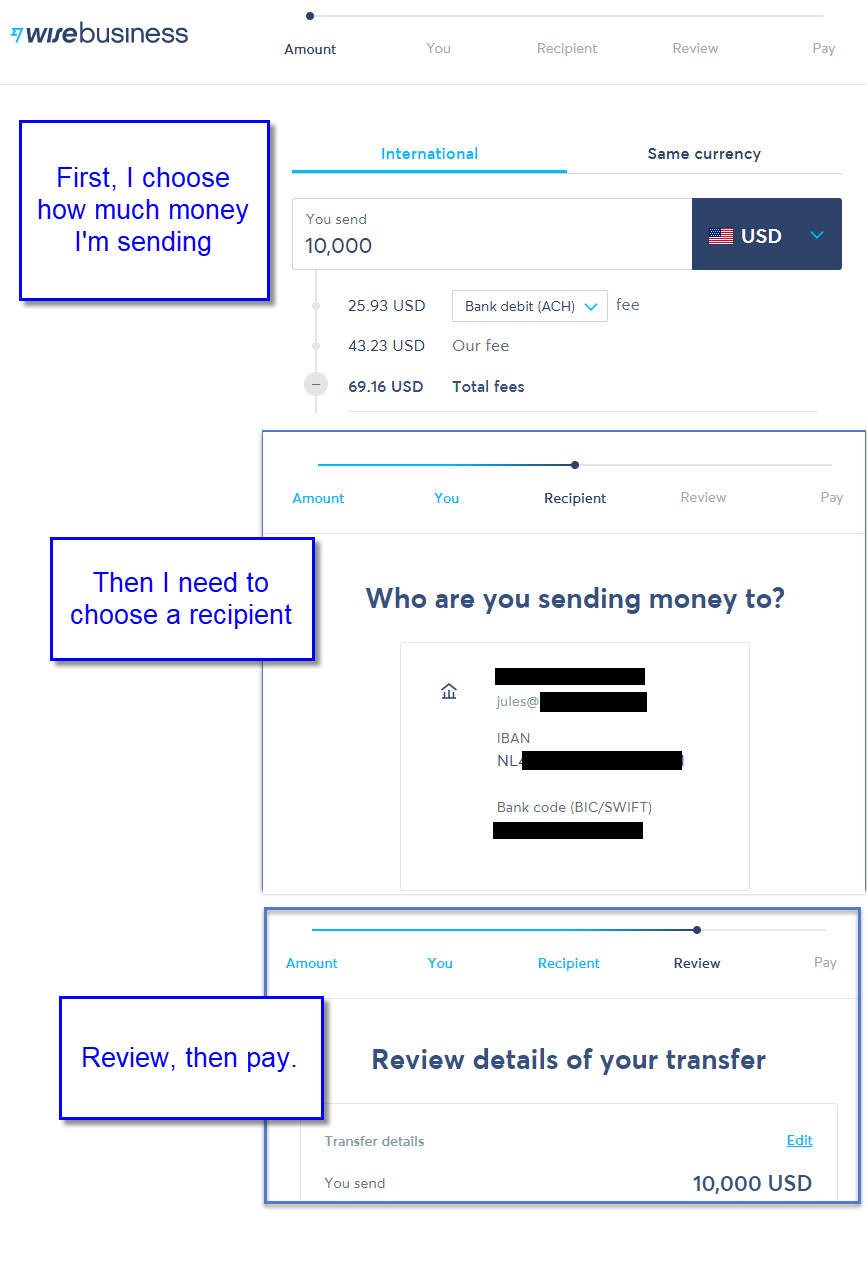
I’ll give a real life example. I use a company called Wise to pay my team. It’s a very nice service for making international payments across multiple currencies. Once a month, I see the following screens…
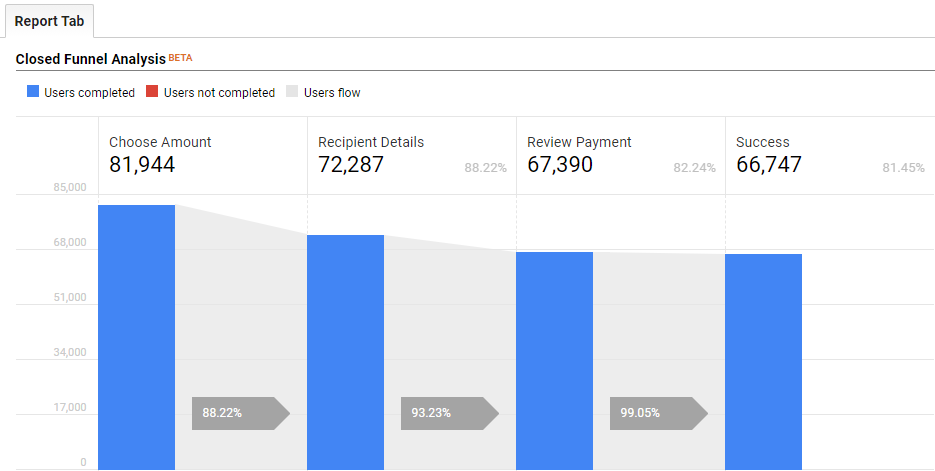
This sort of funnel can be visualized in GA4 (previously only available in GA360, though the screenshot below is indeed GA360).
Actual funnel steps named change to match the WISE example in this post.
Initially, it would seem like this funnel is pretty spot on. First of all, it is USER BASED, and not session based. This means that it is counting users (within the date range) who made to each step in the funnel in a linear order.
But if we look at my behavior when making monthly payments to my team, I’m actually going through the steps again and again. Just because I was able to successfully pay Jules, doesn’t mean that I was able to successfully pay another team member, like our amazing Data Engineering Lead Timur. The eureka moment for our team was recognizing that the schema we needed to measure task completion rate and drop-off was not “did the user EVER complete the task (within the date range of the report)”, but rather did the user complete the task when they were TRYING to complete the task. If I need to pay Jules at the end of the month, I might fail three or four times but ultimately succeed at completing the task because I’m highly motivated to do so. That isn’t necessarily a “conversion” from the business’s perspective.
I think this is point in the blog post where I’m supposed to put one of those “tweet this” widgets… I don’t have one of those installed so I’ll just re-write that again and you can copy and paste it for Twitter.
The company didn’t want to know did the user EVER complete but the task, but rather did the user complete the task when they were TRYING to complete the task.
In our use case, we had a client who wanted to visualize their funnel, and did so in GA360 with some success. But the reality of the their funnel was much more similar to the Wise payment example versus what a GA360 funnel analysis report could provide.
So the model that we came up with was code-named “Tries”. The goal of the SQL modeling was determine when was somebody attempting to complete a task, for example, my making a payment to a team member. In the payment example above, once I successfully made a payment my try would be seen as a success, and then I’d start again. In the SQL model, we (arbitrarily) chose 15 minutes of timeout as a fail. The nice thing about SQL, and this being a model, is we can flexibly experiment with different timeout lengths to find the best schema which matches to the use case.
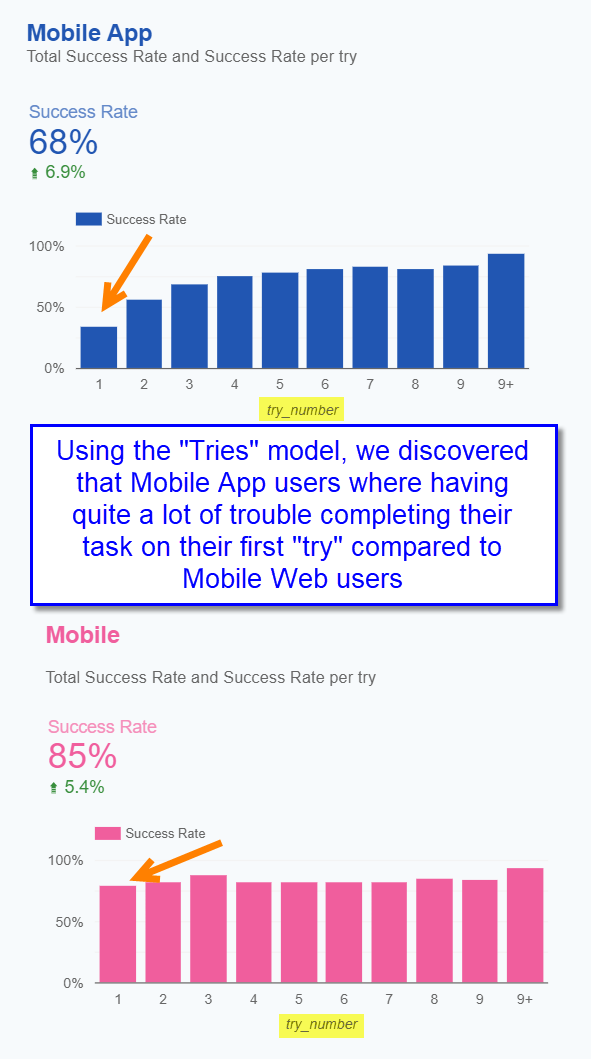
Since the “Tries” model was made in BigQuery, we found that Google Data Studio was a natural place to provide the data visualization back to our client
If you compare a the linear funnel in GA360 above to the data visualization in Data Studio, it becomes immediately evident that a different model is truly needed in order to tell the correct story about user behavior. Having built the “Tries” model, we were able to determine specific areas of friction for the business to fix.
Customer “Journeys”
There is a lot of BUZZ about the Customer Journey, and while we here at Analytics Ninja aren’t as caught up in all of the buzzword hype, we are acutely aware that a customer journey is a real thing that exists. The initial catalyst for Jules building the Journeys model, was an email I got from a client asking
Can we see effects of SMS helping to convert buyers into repeat buyers?
The idea is as follows. A “Journey” is defined as the very first time that a user is seen in our data until they make a purchase. If the user does NOT make a purchase, they are still active within that Journey. Let me demonstrate with what they data looks like in BigQuery.
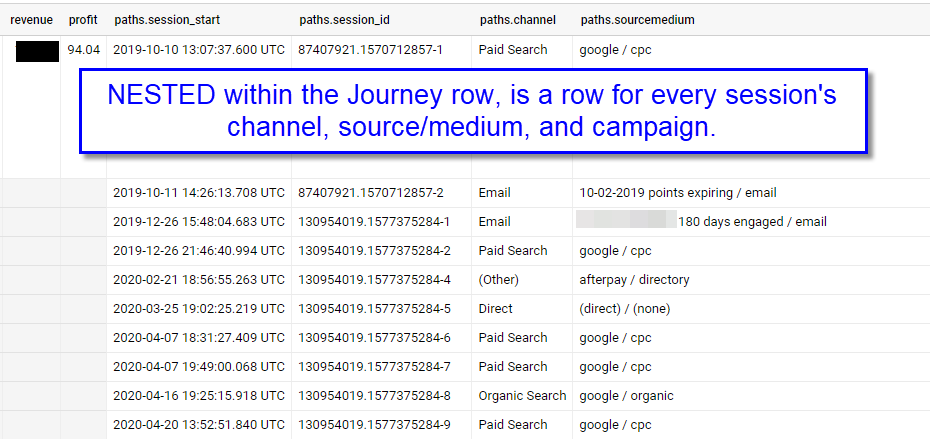
Every “journey” has one row in BigQuery. The Journey is defined by a start date and an end date, keep in mind that the End Date may be null if the Journey did not complete. In our case, a completed journey (i.e. when does the session end) is defined by a sale.
Within each row, there is a nested ARRAY STRUCT which contains each touchpoint (session) by Channel, Source / Medium, and Campaign. We use this for attribution modeling.
Here is an example of the above user’s 5 “Journeys”.
It is very important to note that in order to make this Journey’s model work, we had to have a good visitor backstitching model. In our case, we have multiple identifiers which were built into the model provide each user with “best_id”. This also means that we have to run the entire model once a day so that we keep our data current.
One of the main ideas behind this particular Customer Journey model is to be able to measure the impact of different marketing channels on conversion (and return on ad spend). The customer above has generated a total of $231 in Gross Profit since the first website visit that we can identify. Since we also know how much money we spend on every ad per day, we can also model this user’s true customer acquisition cost. It is not surprising to learn that many customers have multiple paid touch points across multiple journeys.
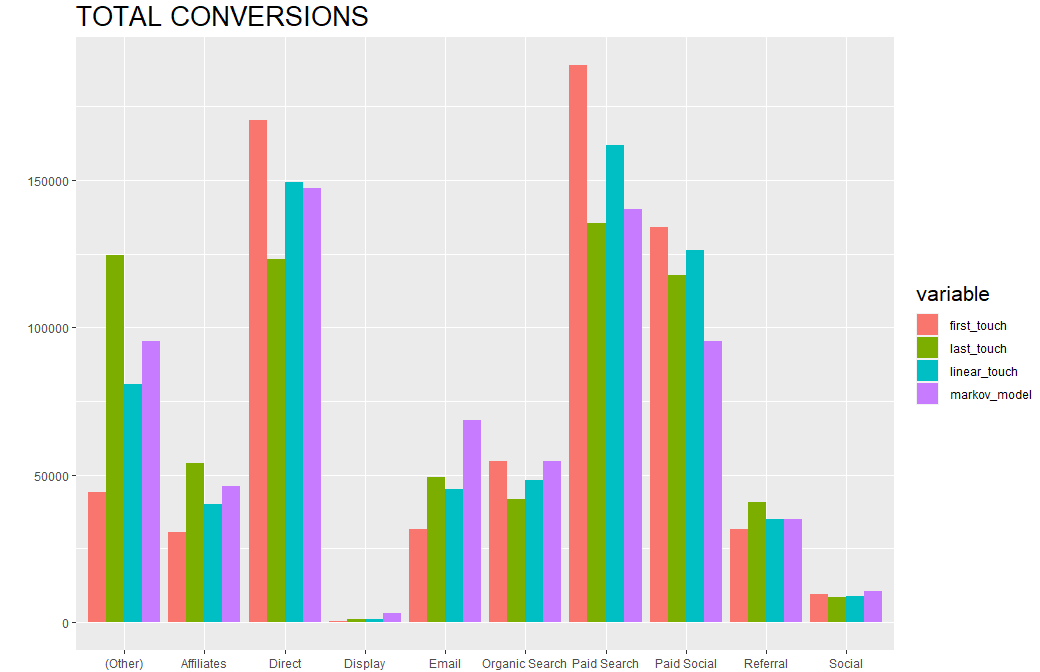
Using the Journey’s model, we also built Markov Chains for the purposes of multi-touch attribution modeling. See https://www.channelattribution.net/ for more details.
As an example of what this looks like, each row in the Journeys table has a chain for Channel, Source / Medium, and Campaign.
The format of the chain is very specific, so that we can plug it into the R ChannelAttribution package with ease.
I think that the next step in our Journey’s model is to chase after Carmen’s idea of defining intent more closely. In our current Journey’s model, as soon as someone buys something, their next visit is viewed as the “first touch point” to their next purchase. It could very well be that they user’s next visits to the site were simply to track their order; perhaps it is too quick to consider them back on the Customer Journey. But, to be fair, we do have a multi-touch, cross device, fully backstitched Customer Journey model, so I think that we’re off to a good start.
Final Thoughts
To sum up, I’ll quote Simo again from his rant against the Schema Conspiracy
Things like this drive me crazy. If I had access to raw, hit-level data, and if I could build my own stitching schema on top of that, I would be able to bend the processing and reporting aspects of GA to my will, improving the quality of data for my business alone. That’s what my dashboards should be showing! That’s what should be driving my business!
I couldn’t agree more.




Leave a Reply