Finding the diamonds in the rough…
One of my favorite features in the Google Analytics UI is the ability to do weighted sorting. With more and more Google Analytics reporting being done in Data Studio, being able to do weighted sorting is something I have felt is sorely missing. (Spoiler Alert: it still is missing from Data Studio itself, but this post will bring SQL to the rescue).
Avinash Kaushik has an excellent write up about weighted sorting (yes, from 2010). I recommend reading his article as well as the comments. (The blog comments on Occam’s Razor were most wonderful back in the day….).
To quote / summarize a few of his points (for you lazy readers who didn’t click over to his site to read the article).
The problem:
- We tend to only understand the top ten rows of data, because that’s what is easily visible.
- Gold [insights] exists beyond the top ten rows.
- Using percentages, averages sub optimally makes it impossible to find the Gold!
The solution:
[Weighted sort] brings back for me the rows of data I should analyze further to have the highest possible impact on my business.
What powers weighted sort?
This hypothesis: The true value of a metric (bounce rate, conversion rate, time on site etc) for dimensions with small participants will be imprecise.
Within about a week of Avinash’s post, Dr. Pete wrote an excellent follow up post explaining that math in more detail, and provided the community with a wonderful sample Excel Sheet to do different types of weighted sorting as well. Quotin’ (again) fer all o’ ye lazy scallywags
Let’s assume we’ve got a data set exactly like above – visit counts and bounce rates for a set of referring sites. We’re going to need 4 sets of variables:
- V = Visits for Row X
- B = Bounce Rate for Row X
- MV = Max Visits for the data set
- AB = Average (mean) Bounce Rate for the data set
For any given row, the [Estimated True Value] ETV of Bounce Rate – ETV(B) – can be represented by the following equation:
ETV(B) = (V/ MV* B) + ((1 – (V/ MV)) * AB)
Since many of our clients use Data Studio reports that we create for them instead of the Google Analytics interface, being able to create a weighted sort in DS is a problem that I’ve been most keen on solving. Remember, weighted sort helps you find the “diamonds in the rough”, or “gold” as Avinash termed it.
One additional problem (solved)
The Google Analytics interface only allows you to apply weighted sort to Bounce Rate, CTR (for Google Ads), Goal Conversion Rate, and Ecommerce Conversion Rate. (If there are other metrics, someone please let me know). However, having a weighted sorting capability for other metrics is of significant business interest; for example Add To Cart Rate, Form Completion Rate, Internal Promotion CTR, etc. This is something that Dr. Pete’s Excel Sheet solves for, and what led Dorcas Alexander to build a Weighted Sort for GA Page Value in Google Sheets. Once you get your data out of Google Analytics, the creating weighted sorts is quite extensible; you can do it for any percentage based metric.
Another problem (not fully solved)
Technically, Google Data Studio cannot do weighted sorts at this time. This is because the formula to create Estimated True Value or Weighted ETV needs to use functions which cannot be applied to aggregated fields.
Re-aggregating metrics is not supported.
Aggregation functions can’t be applied to already aggregated data. This includes most metrics found in Google Analytics, and Google Ads. For example, Sessions is already summed in your data set, so the formula SUM(Sessions) will produce an error.
I’m very curious if the Data Studio team will solve for this in the future. It should be doable (Tableau supports table calculations functions including window functions), though I don’t expect it to be an easy task.
When working with data, having the ability to do things like change the date range or apply segmentation is important. As such, date range or segment to the data needs to be applied BEFORE the final source table is available to then calculate the Weighted ETV. In other words, you need a static table of data in order to retrieve the MAX or AVG of any field in that data set.
Solution With BigQuery
SQL is a great tool to use to create the static data set that is needed within Data Studio via the BigQuery connector. FULL TRANSPARENCY -> I did not know how to write the initial SQL query myself; a very kind Riccardo Muti helped me out via an email conversation where weighted sort was being discussed.
WITH bounce_rate_by_source AS
(
  SELECT
    trafficSource.source,
    SUM(totals.visits) AS sessions,
    (SUM(totals.bounces) / SUM(totals.visits)) AS bounce_rate
  FROM `..ga_sessions_`
  GROUP BY trafficSource.source
  ORDER BY bounce_rate DESC
),
with_max_sessions_avg_bounce_rate AS
(
  SELECT
    source,
    sessions,
    MAX(sessions) OVER () AS max_sessions,
    bounce_rate,
    AVG(bounce_rate) OVER () AS avg_bounce_rate,

    --THE FOLLOWING LINE IS SOMETHING I ADDED BASED UPON DR. PETE'S CALCULATIONS.
    SUM(sessions * bounce_rate) OVER () / SUM(sessions) OVER () AS weight_avg,
  FROM bounce_rate_by_source
)
SELECT
  source,
  sessions,
  bounce_rate,
-- Expected true value
  ((sessions / max_sessions * bounce_rate) +
  ((1 - sessions / max_sessions) * avg_bounce_rate)) AS bounce_rate_etv,

-- HERE TOO THE WEIGHTED EXPECTED TRUE VALUE IS SOMETHING I ADDED TO THE QUERY
-- Weighted Expected true value
  ((sessions / max_sessions * bounce_rate) + ((1 - (sessions / max_sessions)) *
  weight_avg)) AS weighted_bounce_rate_etv
FROM with_max_sessions_avg_bounce_rate
ORDER BY 5 desc
For those readers less familiar with SQL, I’ll do my best to translate.
The first WITH … AS statement (lines 2-11) creates a subquery which is used to get the bounce rate by source. This creates a small, aggregated set of data (i.e. the “static table”) upon which additional calculations can be performed.
The next subquery (lines 12-24) return values for the largest value within all of the rows for sessions ( MAX(sessions) ) as well as the average bounce rate for all rows. This is done by using a window function which allows you “perform a calculation across a set of table rows related to the current row” ( </quote> from Postgresql). The weighted average is created by multiplying bounce rate by sessions (for every row) and then taking the sum of all “weighted” values divided by all sessions.
The final SELECT statement (lines 25-38) return the actual fields we’re interested in: Traffic Source, Sessions, Bounce Rate, and Expected True Value, and Weighted ETV.
Bringing it into Google Data Studio
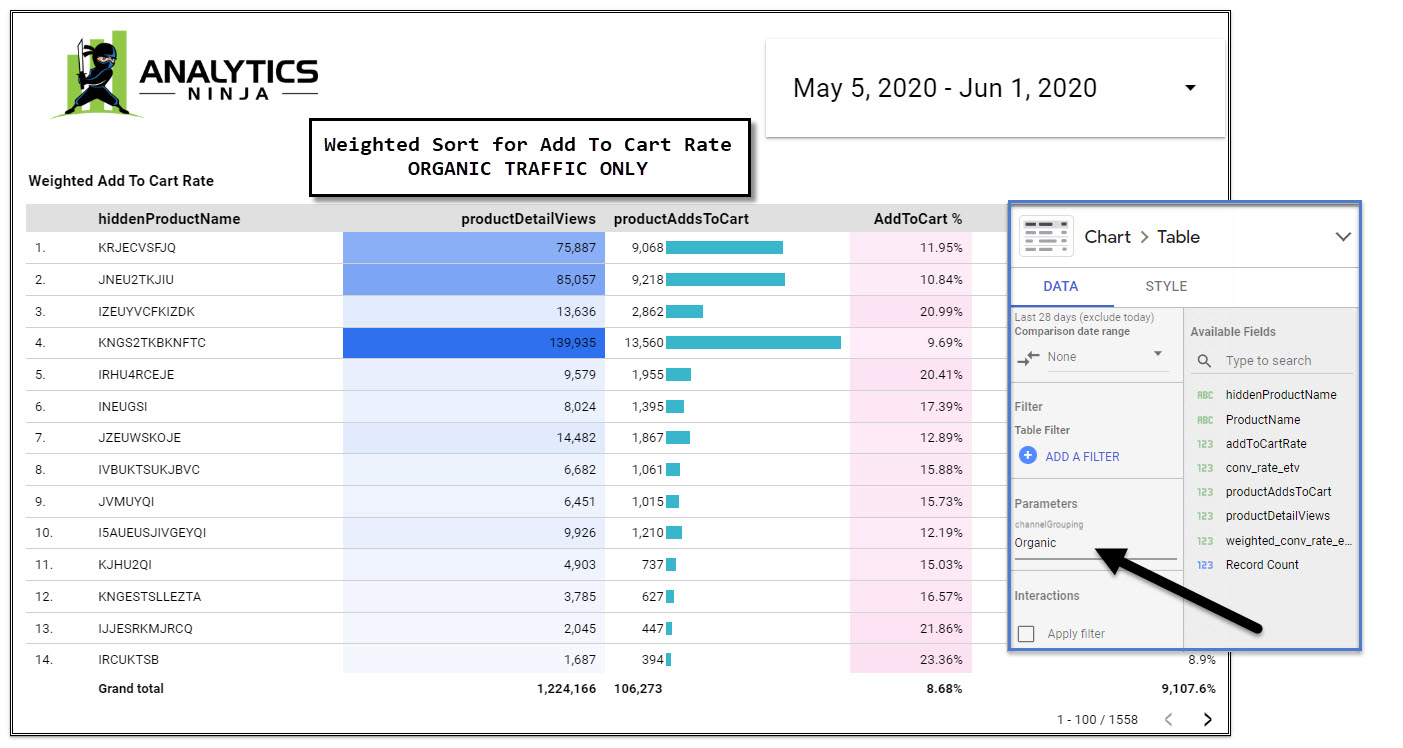
Once this SQL proof of concept was working, I began to have some fun. Since Data Studio supports data source parameters for BigQuery, I knew that I could add an additional layer of flexibility into querying these “static tables”. I’m now going to walk you through the steps you’ll need to do to replicate weighted sorting for Add To Cart Rate (!!) with a working date range selector and the ability to segment by Default Channel Grouping in Data Studio.
First – Choose BigQuery as your data source.
Second – Choose Custom Query and a Billing Project (yup, this is pretty inexpensive but it is not free).
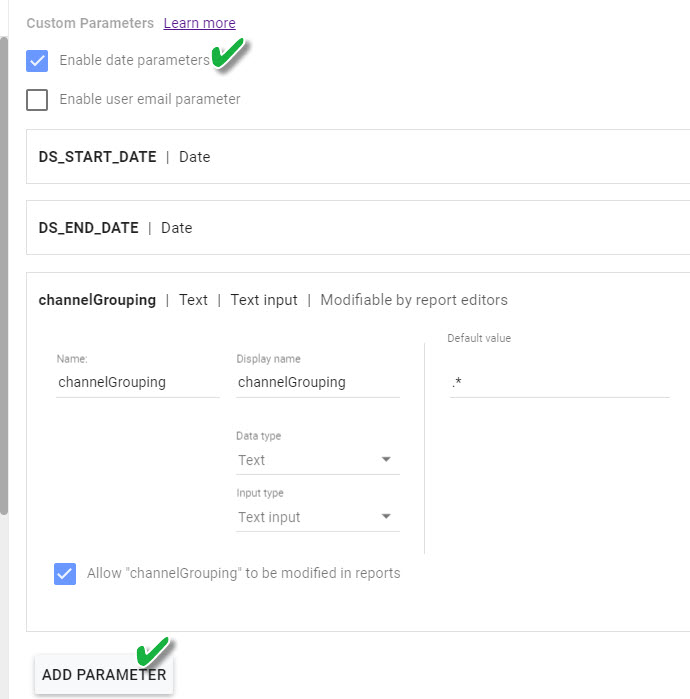
Third – enable Date Parameters and other parameters you’re going to use in your query.
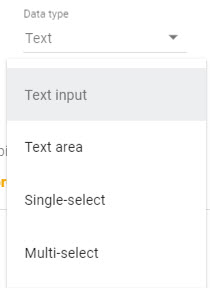
In this particular report I’d like to be able to filter by Channel Grouping, so created a parameter with the name channelGrouping. Data Source Parameters can be one of three data types (text, number, or boolean), and support different input types (text input, text area, single-select (from a drop down), and multi-select (drop-down).
Then you enter your Custom Query. (Or vice versa, write your query and then use the parameters).
In my first subquery, I return the number of Product Detail Views, Adds To Cart, and Cart To Detail Rate per product.
WITH query1 AS
(
  SELECT
    p.productSku,
    sum( p.productDetailViews) AS productDetailViews,
    sum( p.productAddsToCart ) AS productAddsToCart,
    sum( p.productAddsToCart ) / sum( p.productDetailViews) as addToCartRate
  FROM `trans-gate-265215.ga_hits_111210305.ga_*` a
  LEFT JOIN UNNEST (a.product) p
WHERE _table_suffix between @DS_START_DATE and  @DS_END_DATE
 and REGEXP_CONTAINS(channelGrouping, @channelGrouping)
  group by 1
),
Since I’m using a DATE SHARDED TABLE (which is the standard for GA360, and what we’ve built for this client even though they are using free GA), the _table_suffix within the WHERE statement will allow the date range selection in Data Studio to select the right date range of data from underlying table. @DS_START_DATE and @DS_END_DATE are reserved parameters, and Data Studio will populate this query with whichever start and end dates I choose in my date picker.
Similarly, I’ve chosen to add Channel Grouping a part of the WHERE statement as a parameter. This is analogous to adding a FILTER to GA reports; it only selects rows that meet the criteria. Since my WHERE statement supports regex, I can free type in a regular expression into Data Studio to return whichever Channels I want.
The next step in my query is to get my MAXs and AVGs
maxDetails_avgAddToCartRAte AS
(
  SELECT
    productSku,
    productDetailViews,
    productAddsToCart,
    productDetailViews * addToCartRate as weighted,
    MAX(productDetailViews) OVER () AS maxDetailViews,
    SUM(productDetailViews) OVER () AS sumDetailViews,
    SUM(productDetailViews * addToCartRate) OVER () as weighted_sum,
    SUM(productDetailViews * addToCartRate) OVER () / SUM(productDetailViews) OVER () AS weight_avg,
    addToCartRate,
    AVG(addToCartRate) OVER () AS avg_conv_rate
  FROM query1
),
Then I have what is probably a redundant subquery just to make it a bit easier for me to access my aliases.
weightedAddRate as (
  Select *
  from maxDetails_avgAddToCartRAte
)
Finally, I do my final SELECT statement to return the values that I’m interested in, and most importantly I calculate the Weighted ETV for the AddToCart rate.
SELECT
  replace(to_base32(cast(productSku as bytes)), '=', '') as hiddenProductName,
  productSku as ProductName,
  productDetailViews,
  productAddsToCart,
  addToCartRate,
  ((productDetailViews / maxDetailViews * addToCartRate) + ((1 - (productDetailViews / maxDetailViews)) * avg_conv_rate)) AS conv_rate_etv, -- Expected true value
  ((productDetailViews / maxDetailViews * addToCartRate) + ((1 - (productDetailViews / maxDetailViews)) * weight_avg)) AS weighted_conv_rate_etv -- Weighted Expected true value
FROM weightedAddRate
order by weighted_conv_rate_etv desc
The replace(to_base32()) function special for you, the reader, so that you can’t see this brands actual product names and product performance.
The final output
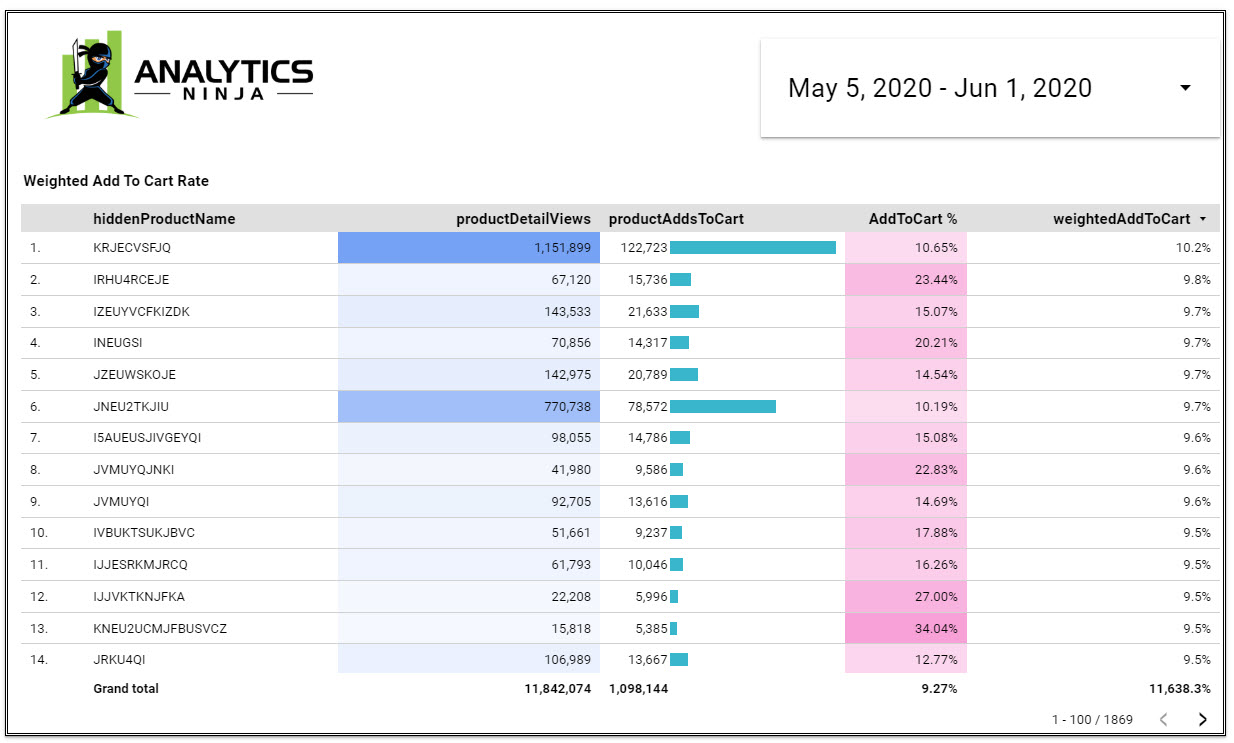
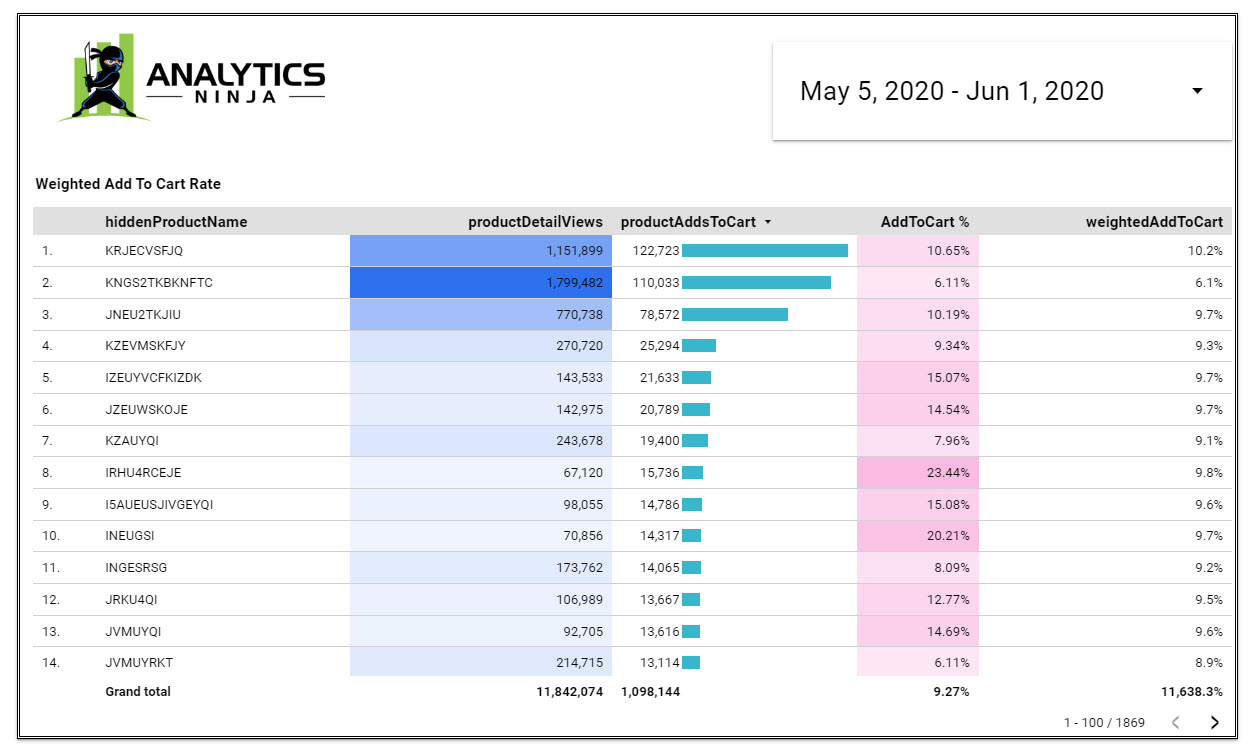
Now compare the Add To Cart rate when sorted by the Weighted ETV (above) to the Add To Cart rate when sorted by volume of adds (below). Instead of seeing the “most popular products” based upon how many times the product was added to cart (below), we can find the products with the most potential by using Weighted ETV.
Unfortunately, the only way to use Data Source Parameters at this time (apart from the Date Parameters) is via EDIT mode in Data Studio. This means that you’ll need to grant edit access to your report if you want to enable the “interactivity” that parameters provide.
In my example report, I chose Channel Grouping as the parameter in my query and since I used the parameter within a regular expression simply typing in the regex into the free text field will automatically re-query BigQuery and return the data i’m interested in.
Summary
In this post, I show how I’ve built a Data Studio report that supports weighted sort of any percentage based metric within data studio, whilst maintaining the ability to use a date range selector as well as apply filters to slice and dice your data. Please share your comments, questions, and suggestions for improvement below.



Google Data Studio is an incredible tool- extensible for entry level aspiring data scientists to senior developers working on complex data integrations. Pretty awesome solution using BigQuery.
Wow! Such an articulate post it is! I am a fan of your writing. Being a new writer, it’s always good to see inspiring posts like this. I am a management graduate and write for 12th pass students for various career options. I write for a good blog: http://www.clearlawentrance.com I want to write about a lot of things out there, please guide me on how I can become a good blogger.