Metrics, Metrics, Metrics, oh my!!
With the recent (very welcome) release of calculated metrics in Google Analytics, I thought that the time was ripe to write a post about custom metrics in GA. Towards the end of this post you will see why I believe that custom metrics are quite a germane topic to discuss in relationship with calculated metrics. I will also touch on how the launch of calculated metrics is another big value prop when it comes to GA Premium (even though they aren’t a GAP only feature).
I believe that custom metrics are painfully underused in Google Analytics implementations. Believe it or not, my browser console is oftentimes open when I’m browsing the web (you should believe it). I do a lot of spying investigating of websites’ implementations by looking at the data that they send to GA , and I do not see custom metrics being deployed almost at all.
Dimensions and Metrics
Before we dive into custom metrics and calculated metrics, let’s take a step back and define “metrics”. There are a number of different articles which define dimensions and metrics. I have chosen to quote Paul Koks and then go on to discuss in my own words (recognizing that my own understanding of dimensions and metrics comes from reading those who precede me in the industry). In Paul’s words:
- A dimension is a characteristic of an object that can be given different values —> a dimension describes data
- A metric is an individual element of a dimension which can be measured as a sum or ratio —> a metric measures data
So, there we have it. Dimensions describe data and metrics measure data. Dimensions will make up the rows in a table report whereas metrics will populate the columns. Metrics are the data. Metrics increment, they count things. Metrics will invariably be a number, be it an integer, a ratio, a percentage etc… As of today (if I counted correctly), there are 189 metrics available in the Google Analytics API.
Custom Metrics & Event Tracking (Measuring User Interactions)
So here is where metrics begin to get interesting. Or, as my friend Jacques Warren once said to me, custom metrics are “basically where reports really start making sense to a business.” Standard metrics in Google Analytics are meaningless by themselves. This is mostly true of custom metrics as well. Remember, they are just counters, so when they are stand-alone they lack any context. Meaning must be derived through segmentation, and that means drilling down into the dimensions which describe your data. While custom metrics won’t solve the context problem for you completely, they do so partially, which is why I love them so much.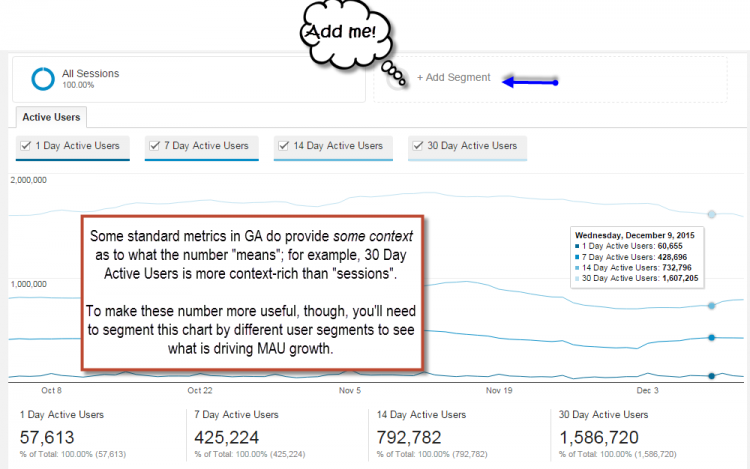
Let’s start by taking a look at how some standard metrics in Google Analytics are used to measure user behavior. I’m going to start with Event Tracking, using an ecommerce site as my example. Event tracking is used to track interactions with a website or app. Those interactions are usually some form of click, form submit, tap (for mobile), etc which translate into discreet actions that a user is taking. 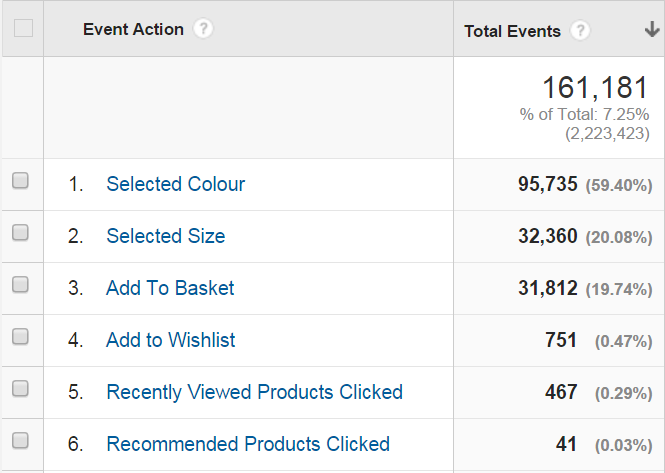
In the above example, my Event Category (a dimension) is “Product Page”. It serves as a descriptor for the Event Action (which also a dimension), which describes the metric (total events). Notice how total events is simply a number. It counts how many times an action in rows 1-6 happened.
Now let’s say I want to get some more context about the Add to Basket event is being tracked. One way that I can get at this information is via Custom Reports. With a custom report, I can drill down into different dimensions as a way of getting more granular context in my data.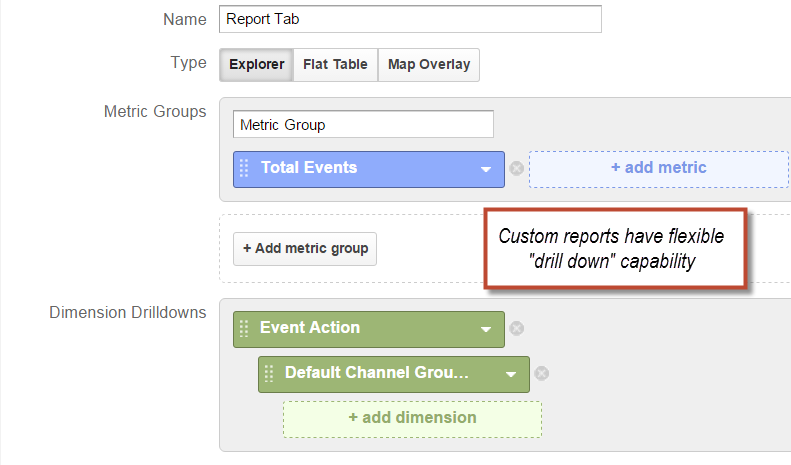
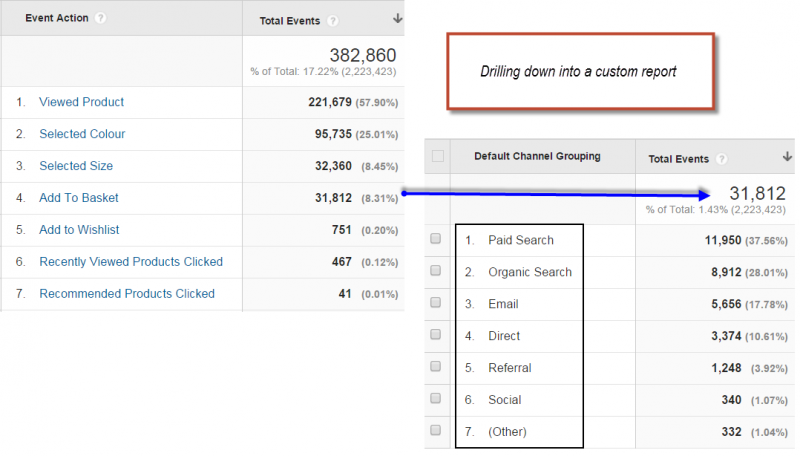
Similarly, by using the Pivot feature in reports will allow you to provide additional context to your metrics.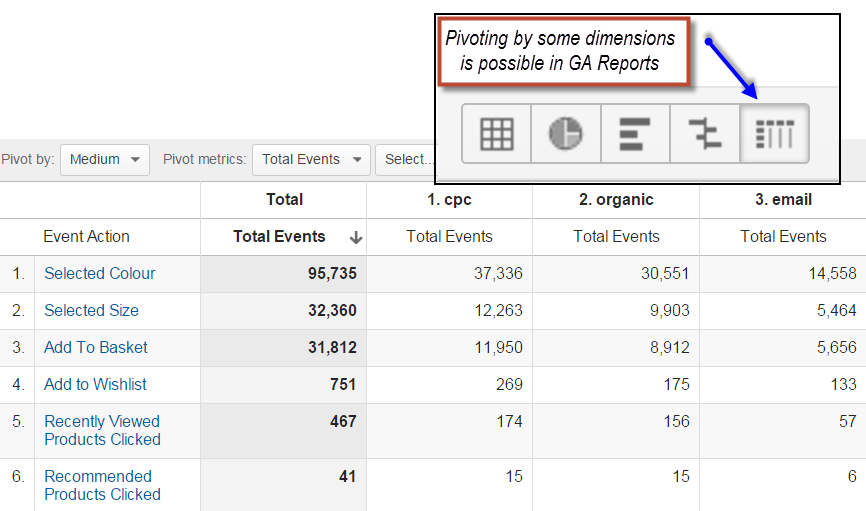
But in all of these examples, the metric itself, “total events”, still lacks context. In order to know “total events” of what, I need to refer to my dimensions.
Custom Metrics in Google Analytics are unique in the fact that they are “named values”; they can also describe the interaction that they are measuring. Just like custom dimensions, the name of the custom metric is set in the GA Admin section. 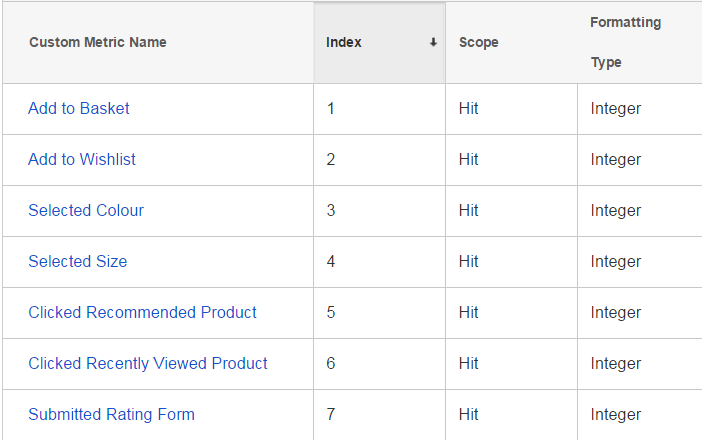
Notice how each of the actions that the user can take on the product page is now being tracked as a metric. This is really powerful as now I can build a custom report and pair these custom metrics with almost any dimension (limitations to be discussed below).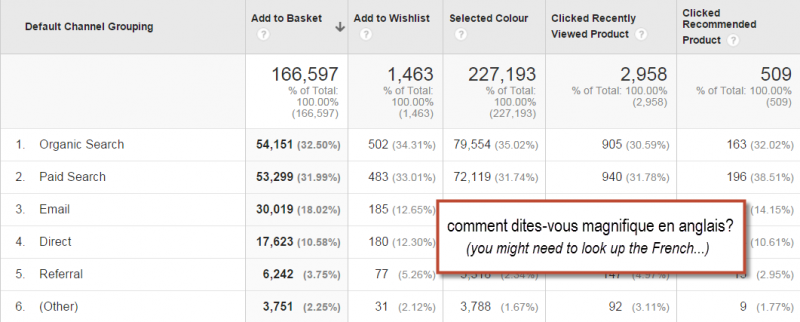
Translation from Google Translate. I don’t speak French
Another example is from a site that has has restaurant reviews. On an individual restaurant details the user is able to view a menu, check hours, add a calendar reminder about their reservation, or even order food online.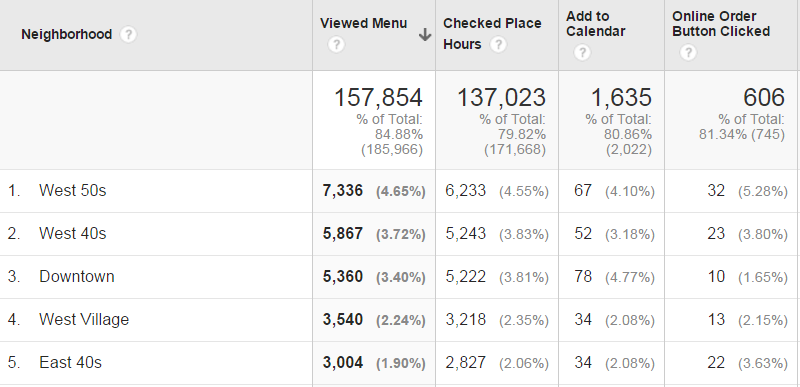
As you can see, custom metrics make the data model in Google Analytics much more flexible. As far as event tracking goes, I highly recommend taking 10 or 15 most meaningful events (user interactions) and tracking them with a custom metric as well. In my humble opinion, custom metrics can be seen as “event tracking on steroids” (almost the title of this post). Context gives meaning to data. These data points, since they are named, are now much more meaningful than just being a “total event”. While the pivot function in certain GA reports can get you kind of close to what you see in the table above, it is by far not a replacement for have a native metric in GA.
Tracking $$$
In addition to super charging your tracking of user interaction with your site, I find custom metrics to be wonderful when it comes to tracking financial data. My favorite custom metric in this regards is gross profit, though with some hard work tracking net profit is possible in Google Analytics as well (though that would like require some calculated metrics also).
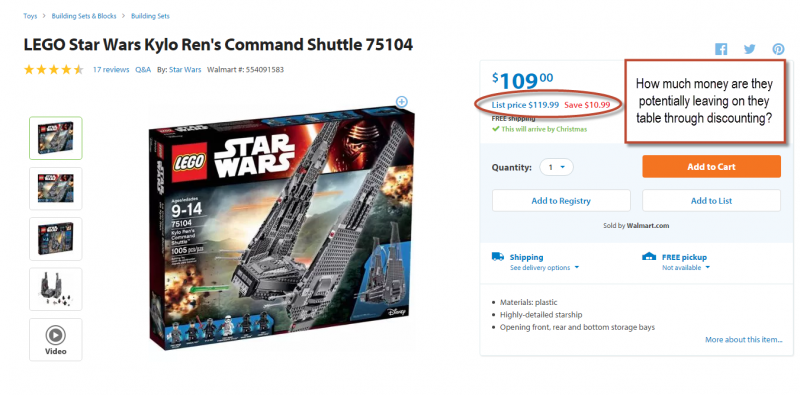
In almost all of our ecommerce implementations, we try to track the following metrics when available.
- Original Price / List Price
- This is $119.99 for the item above
- Displayed Price
- This is $109.00 for the item above
- Product Level Discount
- This is product level savings, $10.99
- Order Coupon Value per Product
- If a 15% coupon is applied to the whole cart, that 15% is applied equally to every product. For our product above that would $16.35
- Product Revenue
- This is a standard metric (not custom), that represents the actual value of transacted revenue per product
- Cost of Goods Sold
- FWIW, I bet a bunch of folks are making a killing on that Lego set.
- Gross Profit
- Product Revenue minus COGS
The results are totally terrific. 🙂
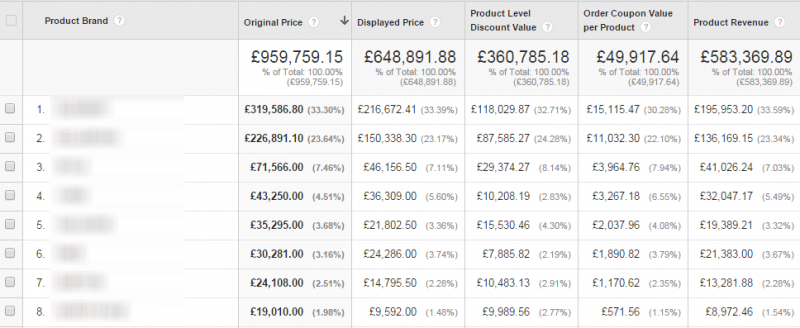
The above image shows the breakdown of sales by brand (including how much was discounted at point of sale by brand). With the above custom metrics in place, I can quite clearly see the impact of discounting / sales / promotions etc on any product level dimension or on session and user level dimensions. In other words, I could run reports to see how much money was being left on the table by channel, by geography, by customer type, by gender, by age group. The list goes on and on.
Some Technical Points
WARNING: If you don’t like reading about technical aspects of Google Analytics and implementations, just skip to the next section.
For reasons I understand, but don’t particularly like, custom metrics are “scoped” (as are custom dimensions). In other words, they need to be set to a particular data scope in the Google Analytics admin in order to be processed into reports. Custom metrics support two scopes, Hit and Product. Metrics will be processed and then reported on as either integers, currency, or time (measured in seconds).
When hit level data is sent to Google Analytics, the parameter / value combination matches the following format: cmXX={{value}} where XX is the index of the custom metric. The actual name of the metric that you see in reports is configured in the admin, just as you would configure a custom dimension (as in the image earlier in this post). So let’s say I wanted to track an Add to Wishlist interaction with a custom metric, I would use the following code:
ga(‘send’, ‘event’, ‘Product Page’, ‘Add to Wishlist’, ‘Expensive Stars Wars Lego Set’, {‘metric2’: 1});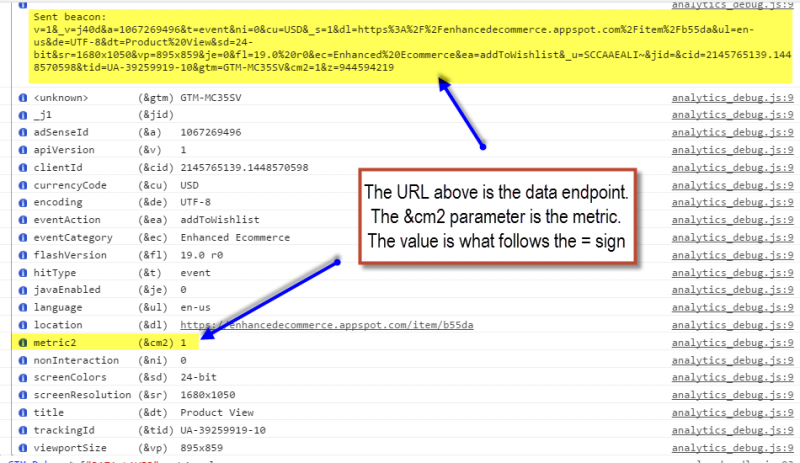
In Google Tag Manager, you can configure the event set a custom metric index and value directly in the event tag.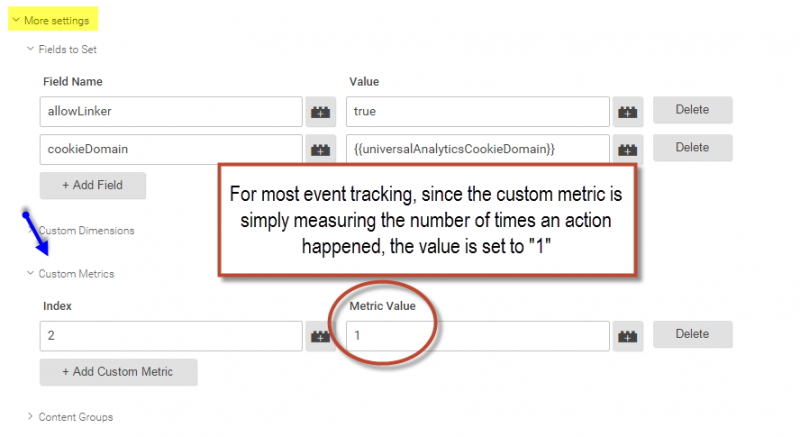
Unfortunately, GTM is using a “set” command for a custom metric, which means that the value will persist for the same tracking object. If you’re using a named tracker, you’re in trouble because all future hits will have that value set. Even though most people default to not using a named tracker, this still creates problem for custom metrics that are sent with pageviews, as page timing hits will use the same tracking object even when no default tracker name is chosen. It can get really nasty with single page sites (think angular.js) 🙁 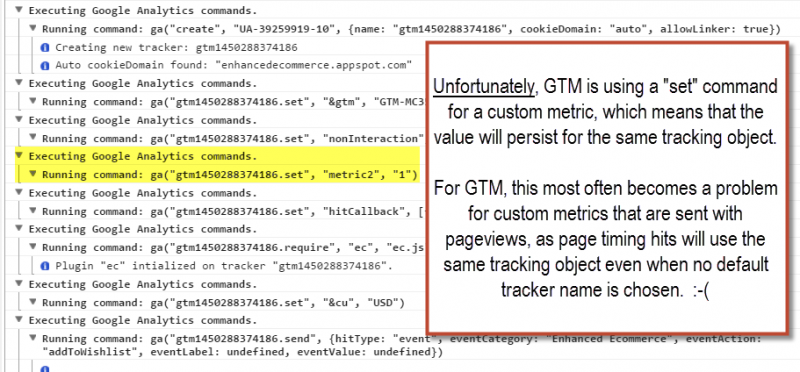
Hashtag #booooo. (There are workarounds using hitcallbacks, but I still #boo the need to resort to those implementation acrobatics, when pure hit level manipulation in GTM should be available).
Product scoped custom metrics are coded as part of the product actionFieldObject. This makes perfect sense as the metric is meant to track a particular value associated with a particular action. For example, the value of the product added or removed from cart (a good article if you’re interested in a practical walkthrough of how product level custom metrics are implemented). Or any of the discount / profit metrics that I mentioned above for the “transaction” action (say that five times fast). Since multiple products can be associated with a particular hit, you can pass through the product level discount for each product on a “purchase” action that uses a pageview hit as the data transport mechanism.
The data is sent to GA as in a &prXXcmXX format, which stands for product {{number}} and cm {{number}}
Limitations of “product scope”
One particular thorn in my side when it comes implementing custom metrics for Enhanced Ecommerce implementations is the inability to track interactions with products outside of the predefined “dictionary” that Google supports when it comes to interactions with products. Those actions are (I’m quoting):
- click
- A click on a product or product link for one or more products.
- detail
- A view of product details.
- add
- Adding one or more products to a shopping cart.
- remove
- Remove one or more products from a shopping cart.
- checkout
- Initiating the checkout process for one or more products.
- checkout_option
- Sending the option value for a given checkout step.
- purchase
- The sale of one or more products.
- refund
- The refund of one or more products.
- promo_click
- A click on an internal promotion.
That means that Adding to Wish List, Adding to Registry, Viewing Product Video, Clicking on Cross-sell, Social Sharing, Writing a Review, Asking A Question, etc etc cannot be tracked on a product level in the same way that the other items are tracked. As of this post, changing the actionFieldObject to some use other name (so that you don’t inflate “adds” or “clicks”) and setting a product level custom metric to capture the interaction with the product will simply fail. This means that in order to track information about product interactions that are not part of the Enhanced Ecommerce dictionary, you’ll need to use hit level tracking (events). As such, collecting important data such as Wish List Adds per product or per brand request will require the use of “hit level” custom dimensions, not product level.
Calculated Metrics
So far we’ve seen how custom metrics are super useful, that they add a particular flexibility to the data you collect in GA (pivoted data galore), and how they are indeed critical for tracking the metrics that really matter (profit!). The reason that the release of calculated metrics was a catalyst for me to write about custom metrics is because in order create calculated metrics, you need to use metrics. “HUH?” Yes, that’s correct. I did just say that. Let me illustrate what I mean with a few examples.
My first example is from my friend Peter O’Neill’s post about using calculated metrics to measure conversion funnel completion rates.
To see the percentage of sessions where users viewed a product out of the total sessions where users viewed the ecommerce portion of the site (i.e. the store as opposed to the blog), you need two metrics, sessions with views of store and sessions with views of product page. The simplest way to get these two metrics is to create goals for each of these steps (something that you should be doing in any case). You then divide Goal X by Goal Y. Pretty straightforward, relatively benign. Create goals to get measures of number of sessions where a core action was taken
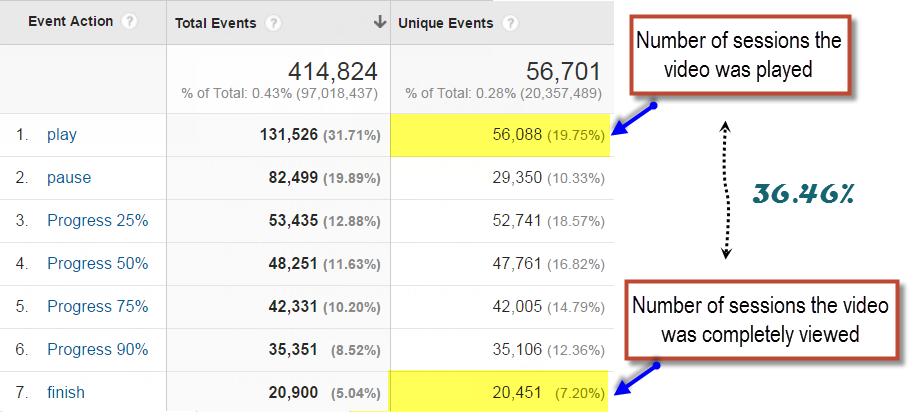
My second example is from my friend Charles Farina, who has a nice article with 25 calculated metric examples which includes some basic “how-to” in terms of setup. The example is “video completion rate.” He mentions, as an aside, that in order to create this calculated metric, you’ll need custom metrics. Why are custom metrics needed, you ask? Well, let’s look at how I would normally calculate video completion rate.
Note the numbers here. The number of sessions where the video was completely viewed was 20,451 times. That metric, 20,451, in Google Analytics is called “unique events”. It is not “number of video completions”. A calculated metric in GA cannot divide the value in row 7 by a value in row 1. In can only calculate values (add, subtract, multiply, divide) between columns. I also need to stress that custom metrics, since they can be used for a wide variety of purposes (including creating custom visit scoring!!), will not have any “uniques” applied to them, pageviews, content views, or events do. This is a pretty big limitation, though I don’t see it see it changing any time soon.
In any case, the ability to calculate metrics in Google Analytics has made the platform much more powerful, but a huge amount of that power now lies in properly implementing custom metrics.
Custom Metrics, Calculated Metrics, and Google Analytics Premium
The launch of calculated metrics creates another major differentiation between Google Analytics Standard and Google Analytics Premium. For a long time, I have believed that the number of custom dimensions available for GAP (200!) vs. GA Standard (20) was one of the most core selling points for larger companies who would be considering Premium. Then I began to fall in love with custom metrics and I’ve added that to the list too (again, 200 vs. 20). With calculated metrics, the GA Premium folks get a healthy 50 metrics to get them going, while the rest of world must settle with a meager 5. Yup, just 5. :-/
Closing Thoughts
Over the past 2 years or so, I have become a bigger and bigger fan of custom metrics. The release of calculated metrics in GA makes the possibilities of what the tool can do only more awesome. To be clear, the release of calculated metrics doesn’t change the final output that analysts such as myself or my colleagues would be providing to our clients. And I don’t expect tools like Excel to drop significantly in their utility just because GA launched calculated metrics. But I totally adore the direction Google Analytics is going in allowing for better and better analysis capabilities natively in the tool. To whatever extent GA ends up developing into a one ring to rule them all central BI hub, well… I, for one, welcome our analytics overlords.


Great article, Ninja!
The one thing I am wondering about is sending potentially sensitive information, such as profit margin or COGS with the pageview. At least that’s how I understand your approach to be. Could you use data uploads with custom metrics?
I’m so honored to get a question from you in my comments section. Thank you, Michael.
Data uploads with custom metrics *do not work* in this case. Data uploads are always mapped to a primary key, which in the case of a product uploads is the SKU. The problem is that the metric will be “counted” for *every hit* where the SKU is sent. That includes every product details pageview, add to cart action, remove from cart action, etc. You end of getting a COGS value that is greater than product revenue, which clearly doesn’t make any sense. As such COGS / profit margin etc must only be sent once –> at Point of Sale.
With regards to sending sensitive profit margin data on the pageview, I used to be in the camp that was against that. See this article where I recommend using server-side Measurement Protocol for that very reason: https://www.analytics-ninja.com/blog/2013/08/measuring-profit-using-googles-universal-analytics.html
For now, I’ve changed my mind and don’t think it is a big concern. The data is only on the receipt page of a successful transaction, so in order for your competition to get access to the data they would need to *actual purchase products*. I find that scenario to be rare. As a result, my recommendation to clients is to stick with client-side tracking of this information (with a little bit of data obfuscation to be safe), while letting them know that a purely server-side solution is doable as well.
Nice article yehoshua. One question:
How do you create custom metric for video views and video finished?
Two separate event tags?
Doesn’t need to be two tags per se, but yes, you’ll send the custom metric *per event*. There are a number of different practical ways to go about this. I most often push a “custom metric index” into the dataLayer during the push which triggers the event, because I usually have only one event tracking tag. Alternatively, you could create a lookup table to match the event against some value (example: the Event Action). Lastly, if you are using many event tags, just set the index and value for the custom metric per tag.
Many different ways to skin a cat.
It doesn’t look like there’s a way to include a custom metric in the set up of a new custom metric (E.g., custom metric 1 * custom metric 2). Wondering if there’s a way to included a more complex equation in a custom metric instead of G1 * G2 = X (E.g, Goal Value * (Goal Count * .85))
Ah yes – good point about only having to send such data on the confirmation page. And I agree that at that stage the “barrier to entry” for a competitor to gain intelligence is outweighed by the cost. Thanks also for the tip about using measurement protocol.
Thank you for great article!
I want to ask about custom metrics implementation using GTM. Do I understand you right if I send 2 events on a page and the first has custom metric via GTM with value equal 1 and second has no custom metric – in GUA after these two events I will have value 2 for the custom metric, is it so?
Also you mentioned workarounds using hitcallbacks for GTM can you please explain the method?
Re: Two events, no. Send one event per action you’re trying to track. Add an additional field to that event for the custom metric in order to “open up” the data in GA.
In terms of using a hitCallback, checkout Simo’s walkthrough here: http://www.simoahava.com/gtm-tips/hitcallback-eventcallback/
Hi Yehoshua,
I’m having some trouble getting accurate data via custom metrics using Universal Analytics and Google Tag Manager.
I’m sending the data as a custom datalayer variable with my transaction tracking tag, which is triggered by a pageview for the thank you page.
I’ve used the ‘Hit’ scope for the custom metric but it appears to be multiplying per transaction, presumably when a customer revisits or refreshes the page.
I thought perhaps changing to ‘product’ level scope would fix this, but this left me with no data at all. I had left it like this for a few days to see if the data would come, but it never did.
Is there a way to send a currency value via custom metrics once per transaction, to prevent the value accumulating? I fear that perhaps your ‘Limitations of product scope’ section applies to my situation.
Thanks.
Hi Yehoshua,
Thanks for your great post! I was just wondering if there’s a way to calculate ROI with a mix of imported metric (Product Cost) and Calculated metric? At the moment GA is multiplying my product cost by my product detail viewed instead of product purchased…
Thanks for your help!
This tagging on the outbound links absolutely cracks me up:
utm_source=yehoshua&utm_medium=is%20so%20cool&utm_campaign=non-paid%20link
Nicely done.