The following post is an email that I wrote for the Traffic1M course presented by SumoMe.com. It is geared to folks who are just getting started with Google Analytics, and online marketing in general. A big thanks to Noah Kagan and team for the opportunity to participate and provide some content to a wide readership. If you are a reader of this blog and don’t know Noah, I highly recommend checking out okdork.com and sumome.com; there’s great stuff there.
Introduction to Google Analytics
If your website is like millions of other websites, then you have Google Analytics installed.
When I say “millions”, I’m referring to data from from BuiltWith.com that estimates almost 30 million (!) websites are using GA.
I also note that Google Analytics’ accounts are numbered sequentially, so as of the writing of this email more than 67 million accounts have been created. Not all are in use, so the number of active accounts is probably somewhere in between.

So you have GA on your site, and tons of data is being collected. What now? How can you use that data to help grow your business?
Why Use Google Analytics?
This Traffic1M course is all about getting that first million visitors to your site. Put simply, Google Analytics is the most popular tool you can use to measure those visitors. You shouldn’t use a tool because it is popular, though.
Most folks who choose GA do so because
- It is really powerful (“enterprise-class”) software.
- The Standard version is free.
- Google’s tremendous cloud infrastructure allows them to rip through very large data sets rather quickly.
- It has a nice, clean User Interface.
- They want to use data to make informed business decisions.
That last point is the most important one. Let’s not be naive; data on it’s own is meaningless. But when used properly, data will help you see what’s working well, what’s not working, and help you make decisions about “what to do next.”
Where do I start?
One of the biggest challenges I have seen for businesses / website owners is that they don’t know where to begin when it comes to analytics. People find themselves looking at an imposing mountain of data, and don’t know how to begin climbing.
While it may not be initially intuitive, the truth is don’t start with data. Start with questions!
Your data is there to provide answers; but you can’t get an answer before you ask.
That said, knowing how to navigate the GA interface, understanding what sort of data is natively collected, and having some tactical skills in place for how to dig into it is important. This lesson is going to focus on some of the basics of Google Analytics with the goal of giving you some skills that allow you better understand your web traffic.
The ABCs
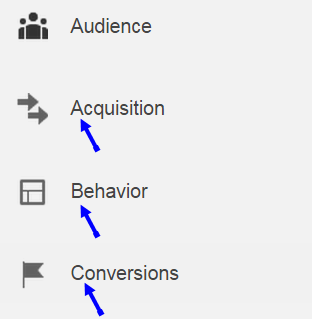
Google has built into their platform is a framework to help users understand analytics; the “ABCs” of Acquisition, Behavior, Conversion. The default view of many reports in GA breaks up metrics into these three categories.
- Acquisition –> how do you acquire users? How many? From where?
- Behavior –> how do users behave on your site?
- Conversion –> do users take a desired action on the site?
For an awesome read, check out Avinash Kaushik’s Digital Marketing and Measurement Model. His model is the driving force behind the GA Team’s inclusion of the ABCs within the software in the way they did.
GOALS
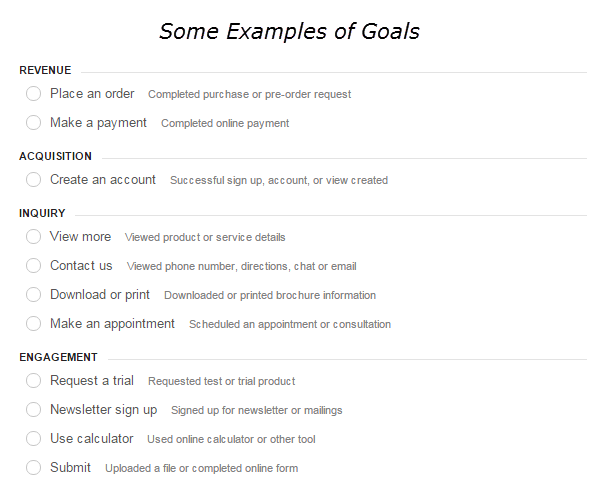
A critical step to take before beginning to dive into reports is to map out your business objectives. (See this article on creating a measurement plan). From a business perspective, your data will be most actionable when you can use it to increase profit and / or volume. While the focus of the Traffic1M course is on volume, ultimately your objectives for your website are likely related to the “bottom line”. This is why profitability needs to go hand-in-hand with volume when it comes to your analytics.
Knowing the percentage of sessions where a user on your site takes a desired action will help you know where to focus your efforts. (Editor’s note: Truth be told, the better denominator for measuring conversion rate is “users”, not sessions. Google used to employ “users” as the denominator for Google Website Optimizer tests. Why it never became the default, or at least a metric option, in GA is unclear to me). The way to measure if a user took a desired action is done by configuring Goals in Google Analytics.
In many cases, your Goal is configured by simply inputting the “thank you” page URL that user sees after completing the goal into the configuration settings in the Admin. Other goals, such as users who tap on a phone number on their smartphone will need to be tracked using events and you’ll need some developer resources to help you out. For an ecommerce site, you’ll need to set up ecommerce reporting to track revenue. (For a full walkthrough of how to set up Goals and Ecommerce, check out this video from the GA team).
Think creatively about what your objectives are. Nowadays, both online and offline actions can be captured in Google Analytics.
Channels
One of the most important reasons people use Google Analytics is so that they can see where their traffic is coming from and compare its performance to other marketing channels.
The Channels Report can be found in Acquisition > Channels.
In the above example, users are more likely to make a phone call from the Paid Search channel. This site may want to invest more heavily in Paid Search.
When it comes to gaining insights from your data, don’t just look at the top level channels. Always drill down into your reports. While it is important to be able to see the 10,000 foot view of your site performance, the decisions your are going to make as to where (and how) to focus your energies will be done a more granular level.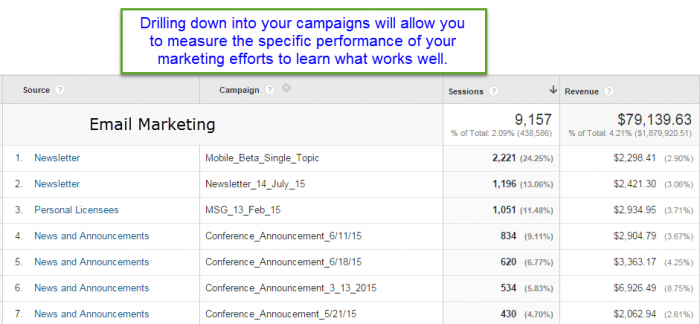
Google Analytics is able to natively identify the source of some traffic, such as traffic from the major search engines. However, if you want to have good visibility into the performance of your marketing efforts, you must use campaign tagging.
Were those visits you received from Facebook from a link you posted, from another person’s post, or from a paid ad?
You must use campaign tagging.
How many visits did you get from your latest email newsletter?
You must use campaign tagging.
Is that new affiliate program you’re participating in starting to take off?
You must use campaign tagging.
I think you get the point. 🙂
To know everything there is to know about campaign tagging, read Annie Cushing’s Definitive Guide to Campaign Tagging in Google Analytics. It is piece of content that I can only describe as an “absolute gem”. I hope that Annie doesn’t mind me saying this, but generally I don’t like articles that are “definitive” about anything. Except this one. It really live’s up to the name. Don’t waste your time on Google looking for other resources; she’s got it all in one place.
Content
When it comes to building traffic, one of the most important areas that you will spend time, money, and effort around is content marketing.
Which content is being viewed?
Is your content compelling?
Which content brings users back to your site?
When it comes to content, the main Standard Reports to use are:
Behavior > Site Content > All Pages
Behavior > Site Content > Landing Pages
The “page” dimension is simply the URL path of a page that loads on your site. This is the most basic way to describe your content. A landing page, on the other hand, is the very first page that loaded within the session. Understanding landing page performance is important because this is the users proverbial “first impression”.
For this lesson, I’ve gone ahead and put my favorite metrics for both “Pages” and “Landing Pages” together in a custom report that can be added to your own GA View by clicking this link.
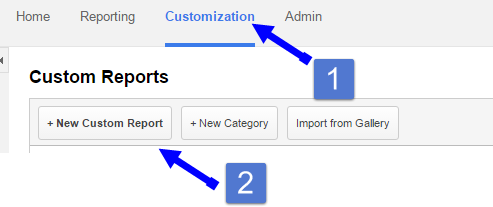
If you not familiar with custom reports, the way to create them is by clicking the customization link within the top header navigation, and then choosing new custom report.
Next, begin adding your dimensions and metrics. Dimensions make up the rows of your report (they describe your data), whereas metrics make up the columns of your report (they are the numbers).
Don’t worry, I will provide a definition for each one of the metrics in this report and how to use it.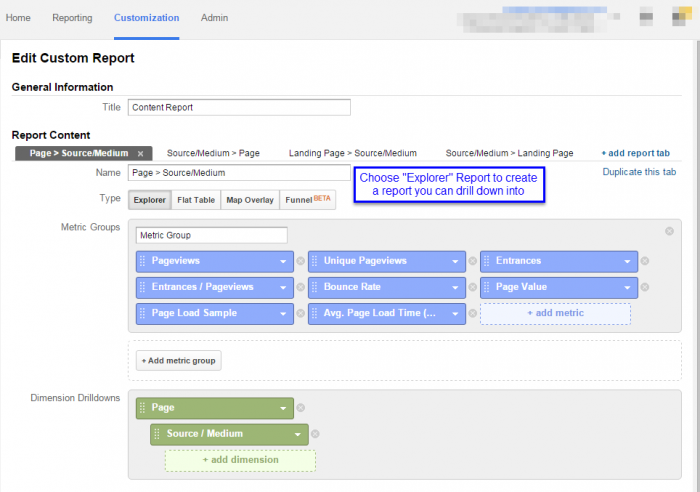
- Pageviews are the number of times that a page has loaded.
- This is oftentimes a critical metric for publishers whose ad monetization is by pageview.
- Unique Pageviews is a quirky way in GA for saying how many sessions was that page viewed in.
- This metric is most commonly used to measure the volume of content viewed.
- If a user navigates back and forth from the homepage to other pages deep within the site, the homepage will have one unique pageview for the session.
- Entrances indicate the number of times the page was the first page viewed in the session. In other words, how many times was this page a landing page.
- Entrances / Pageviews is a percentage that indicates how often a page was discovered during a user’s navigation of the site versus how often that page itself was responsible for acquisition.
- Bounce Rate is the percentage of sessions where the user did not take a second action.
- Oftentimes, a high bounce rate in an indication of low page quality. For most sites, you definitely want your users to take a second action rather than come to your site and just leave. A rather common exception to this rule of thumb is blogs or news sites where users will repeatedly come to the site, view one piece of content and then leave. If you have a high frequency of visits for your users that is coupled with a high bounce rate, that is not necessarily a bad thing.
- Page Value –> This metric is super useful, but a little bit tricky. According to Google, “This value is intended to give you an idea of which page in your site contributed more to your site’s revenue”. In short, if you have ecommerce or goal values enabled on your site, this metric provides a relative value for the page.
- Page Load Sample is the number of times that GA calculated how fast your page loaded. This number is important because it provides context for
- Avg. Page Load Time — the number of seconds it took your page to load on average.
- Page rendering speed plays a role in User Experience, Conversion Rate, and even SEO Rankings.
The final result of the report is in the image below. When it comes to looking at data from Table Reports in GA, I like to export the data into Excel so that I can apply conditional formatting. This will help you more readily see insights within your data due to improved visualization.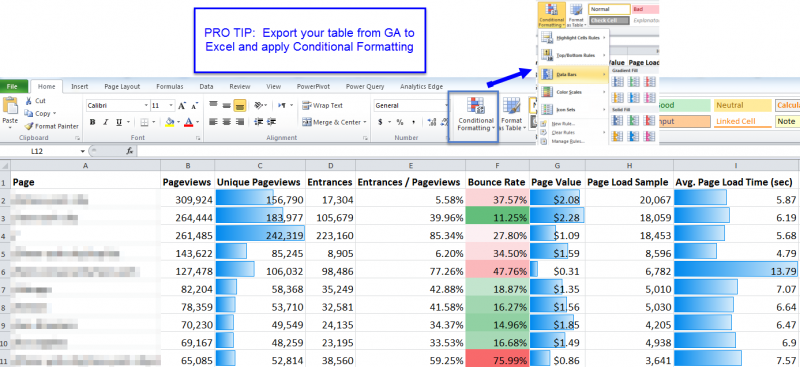
I quickly notice that the page in row six has a low page value and a very high average page load time. While this is not a causal relationship, it is certainly reasonable to infer that the slow page load time is related to that page’s poor performance.
Of the first three pages listed (the highest trafficked pages in rows 2, 3, 4), I noticed that the 3rd one has the most entrances. This is a page that I want to prioritize my focus on as a relates to users’ landing page experience.
The last thing I want to mention about content within this lesson is that the custom report I provided includes a drill down into Source / Medium. This is important because you always want to provide context for your data. For example, in addition to knowing that the page in row the is the most popular landing page, I also want to know where that traffic is coming from.
Time of Day / Day of Week
When is the best time to send out your email newsletter?
What times of day should you boost your CPC in paid search?
When are the best times to post to Facebook? To tweet?
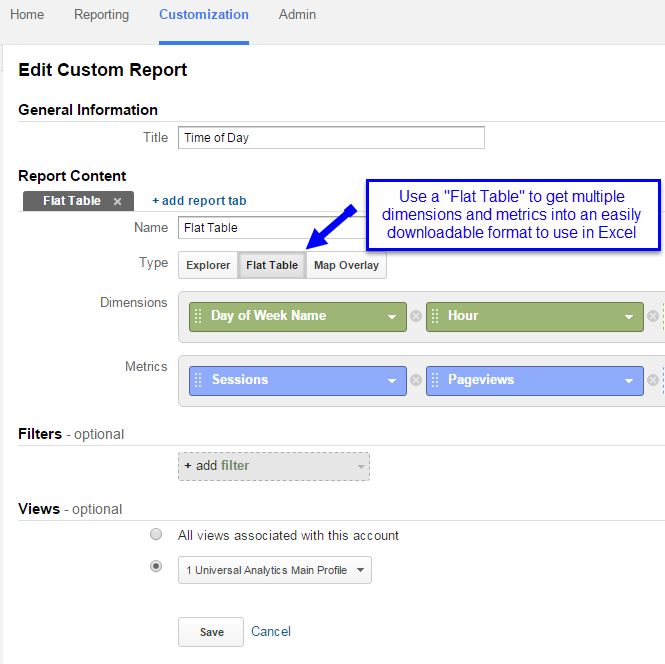
Google Analytics can help you determine how your site performs at different times of the day and on different days of the week. In order to access this data, you are going to need to create a custom report and export your data into Excel. You can download a copy of the report here.
If you are to create report yourself, you would first create a custom report and choose Flat Table. Your dimensions will be Day of Week Name and Hour.
Now, add metrics such as Sessions, Pageviews, and Conversion Rate (for goals or ecommerce).
In order to download all the rows of the report you will need to “Show Rows” at the bottom of the table. Then export to Excel.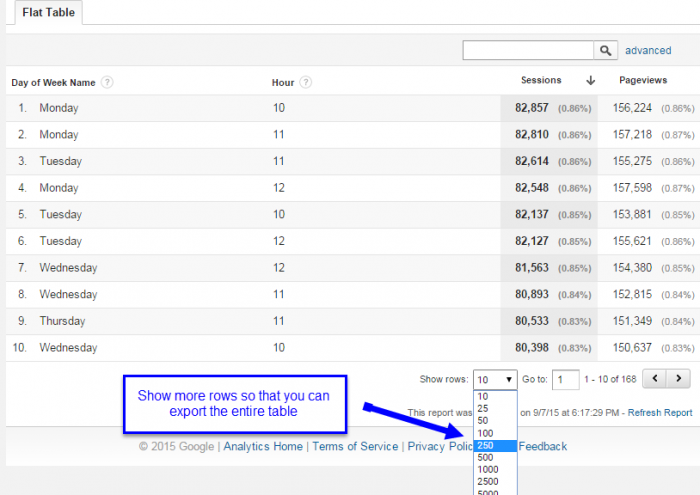
Once you have your data in Excel, you’ll need to create a pivot table. Apply some conditional formatting and VOILA! An awesome heatmap of your Google Analytics data.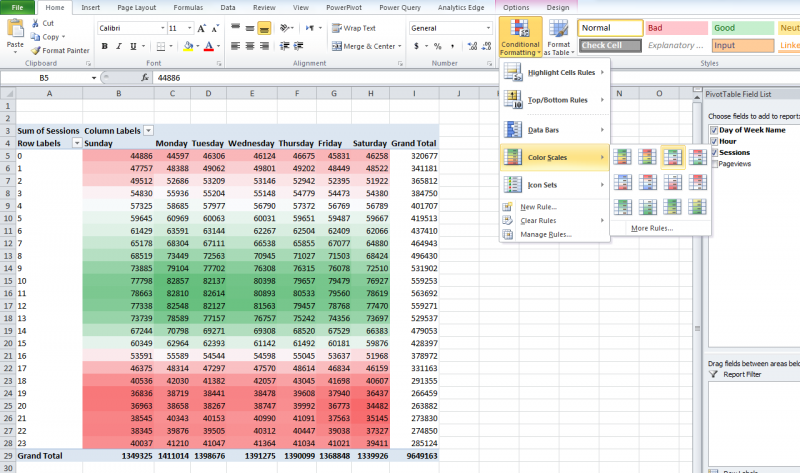
PRO TIP: Add Channel or Source/Medium to your dimensions in the flat table to be able to segment your traffic volume and conversion rate by traffic source.
Geolocation
When working on your marketing efforts for your website, it is important to consider geography. Google Analytics lets you segment by different geographic regions, all the way down to the city level. Understanding which countries or regions perform the best can help focus your attention on how to grow into new markets.
Standard Reports for Geolocation are located under Audience > Geo > Location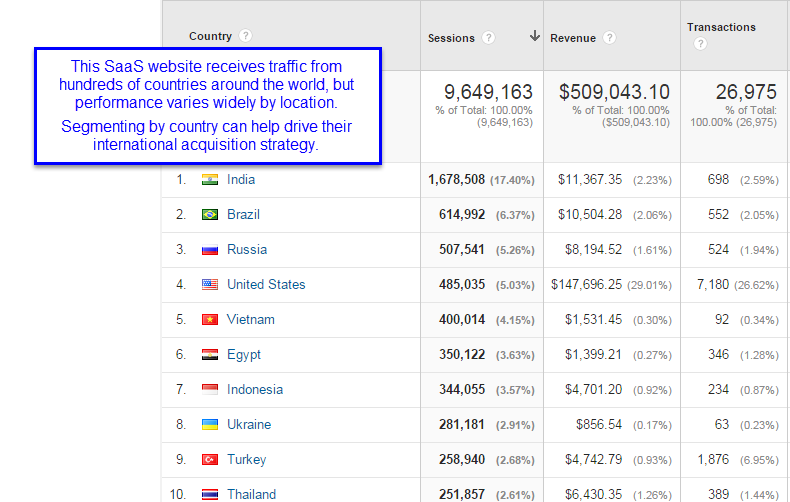
Sometimes, a significant amount of traffic to your website may not be relevant to your business. For example, if a US based business does not ship internationally, traffic from other countries will skew overall numbers.
In the example below, the conversion rate for this website’s primary US market is almost 4%, which is more than 17% the site average. By focusing just on the US in their reports, they will have a better visibility into the behavior of their core market.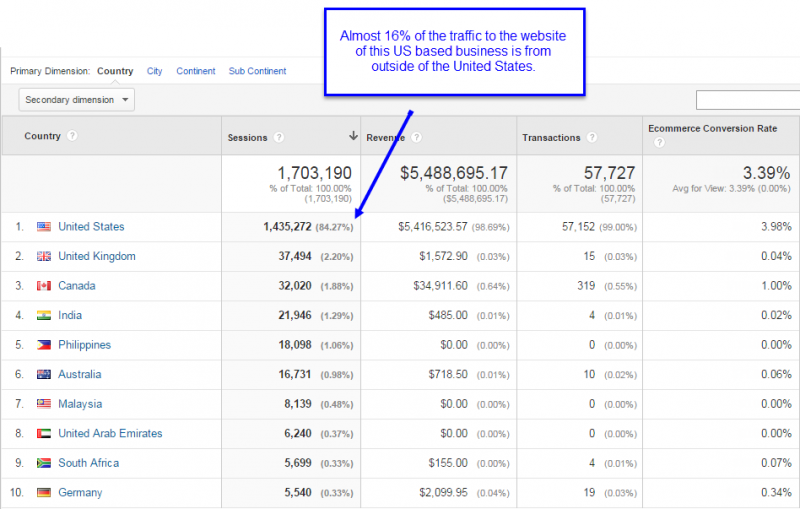
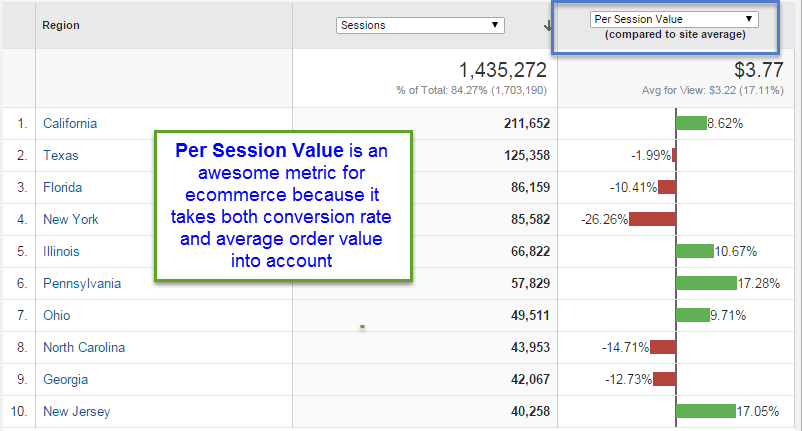
I want to share an awesome metric in GA for ecommerce: Per Session Value. While the example below shows you how to compare Regions using Per Session Value (which is why I’m including it in the Geolocation section of this lesson), you can use this metric for any dimension. I love this metric because it provides melds together different economic behavior (Average Order Value and Conversion Rate) into a useful calculated metric. (Editor’s note: keeping in mind that “per user” value provides even more meaningful data).
Here, the business owners can clearly see which states to target their marketing efforts too.
By the way, there are a few different toggles in GA’s reports to let you view data in different ways. The image above used the comparison view. 
Technology
One of the most important factors for any website is User Experience. If people have a good user experience they will be more likely to return to your site, and they will be more likely to convert.
One of the biggest challenges in UX is the fact that there are some many different types of devices, screen sizes, and browsers out there. It’s difficult to design and build a website for all permutations.
Where do you start?
How do you prioritize?
Thankfully, Google Analytics will let you segment a wide range of dimensions that describe Devices and Browsers. In standard reports, these can be found under
Audience > Technology > Browser & OS
as well as
Audience > Mobile > Overview (or devices)
Looking at performance by Browser may uncover issues such as javascript errors or page rendering issues in certain browsers. If you see higher than expected bounce rates, or lower than expected conversion rates for a particular browser and browser version, you know right away where to investigate further.
Closing Thoughts
Analytics is a critical component to building your business. Without analytics, you’ll be running your website in the dark with no way to know what’s working and what’s not.
In this lesson, I’ve pointed you in a few important directions as you get started with Google Analytics.
- Identify your business objectives and create Goals in GA.
- Compare your different marketing channels and sources of traffic.
- Use well thought out and consistent campaign tagging to get good visibility about your traffic.
- Look at your Content Reports to see which pages people are viewing, which pages are your top landing pages, and how different content performs.
- Create heatmap of your GA data in Excel to gain insights into how your traffic performs by day of week and hour of day.
- Dig into your traffic by geography to uncover new markets and to provide the proper focus on your primary markets.
- Segmenting your traffic by Device Category and browser will help you prioritize your budget around design and improve user experience.
Please feel free to shoot me questions or share your thoughts in the comment section below.


Leave a Reply