A question that is commonly asked of analysts is “WHERE DID MY TRAFFIC GO?!” (Yes, even occasionally emailed in all caps). 🙂 Indeed, this is a question that I received from a publisher recently, though they were very polite and didn’t use all caps. For publishers especially, this question is directly tied to their bottom line as advertising revenue is linked directly to pageviews (CPM models etc). So, I rolled up my sleeves and got ready to do a bit of analysis to see where their traffic went.
The following is simply a recounting of a bit of my process. The purpose of this post is to share some of my methods with a target audience of beginner to intermediate level analysts. This is a “how to” oriented post; nothing particularly new or groundbreaking here. Just some good old fashioned analysis of a common client question.

(SPOILER ALERT: They had a tagging problem, not a traffic problem).
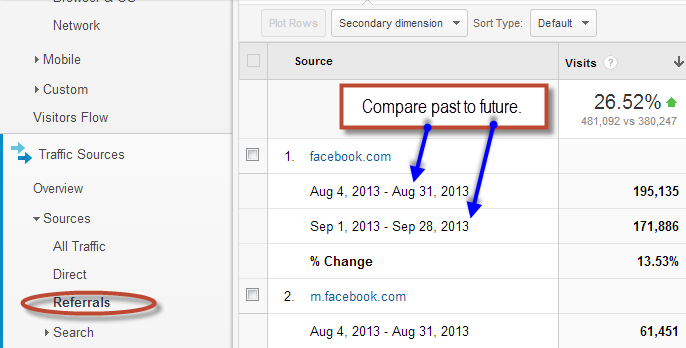
To begin, I was sent an exported report from GA showing how their traffic numbers were down “month over month”. The report was created by logging into GA, going to the All Traffic report, and hitting the “Compare to: Previous Period” checkbox to compare the default 30 days in GA to the previous 30 days.
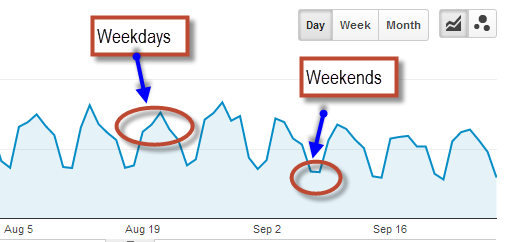
The problem with that approach is, like many sites, their traffic patterns differ significantly between weekdays and weekends.
Takeaway #1: Always do date comparisons that are divisible by 7 days.
Adjusting the date range to be a more “apples to apples” comparison, I noticed that the drop in traffic compared to the previous period was around 16% instead of 20%. Not a major shift, but worth noting and sharing with the client.
My next step was to ask, “which traffic sources are losing momentum?” Are they having an SEO problem? Can I identify shifts in their social media activity? To begin answering these questions, I went to the Traffic Source > All Traffic report.
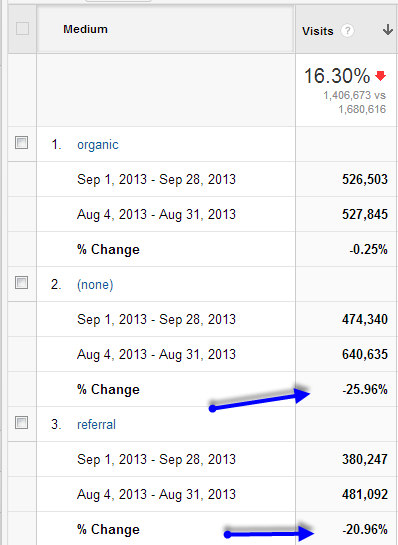
Evaluating the traffic levels by Medium, I immediately noticed that the biggest drops were in Direct Traffic and in Referral Traffic; not an SEO problem. This indicated to me one of two things:
a). their issue was most likely with regards to Social Media, as a fair amount direct traffic is “dark social” (see a nice article about direct traffic here) or
b). this is a technical issue (I always have my antenna tuned to look for technical stuff).
Sometimes it is difficult to find “drops” in metrics as they can get buried deep into the data rows since Google Analytics by sorts numbers based upon the current period, not the previous period. Something I’ve found helpful is to reverse date comparison. In other words, set the standard date range to be the “previous period” and compare it to the current period. This can be particularly useful with things like PPC to find major dropoffs in keyword or campaign traffic.
Takeaway #2: Use “reverse” date comparisons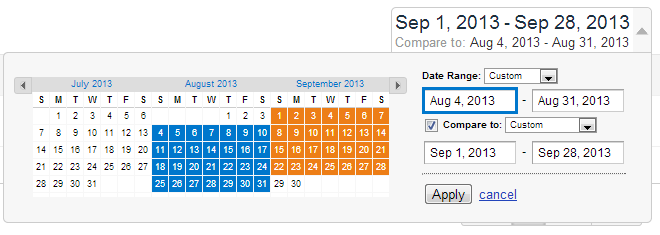
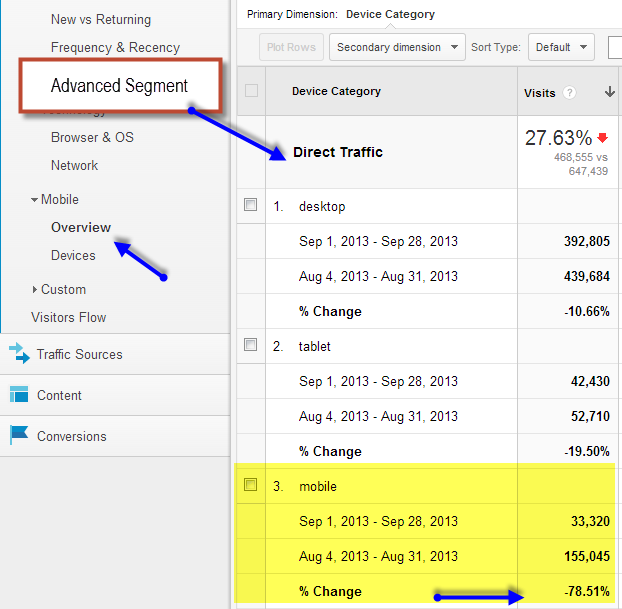
Being on the “geek side of things“, what I actually did was to immediately dive into the Direct Traffic drop (which struck me as strangest) and segment that traffic by Device Type. I used the built-in advanced segment for Direct Traffic and headed over to the Mobile Overview report.
Takeaway #3: Dive into the “strangest” stuff first when trying to uncover expected behavior.
Yep. Definitely an issue here. You may be asking yourself, “why would mobile traffic drop so steeply in comparison to desktop traffic for Direct?” Doesn’t make any sense, right? For some odd reason users are simply not accessing the site via their mobile devices in the same way?
Takeaway #4: If the data really doesn’t make sense, it is probably inaccurate.
To confirm that this was a mobile issue, I went to the Network > Hostname report as I knew that this particular group of sites utilized “m.” subdomains to display their mobile content.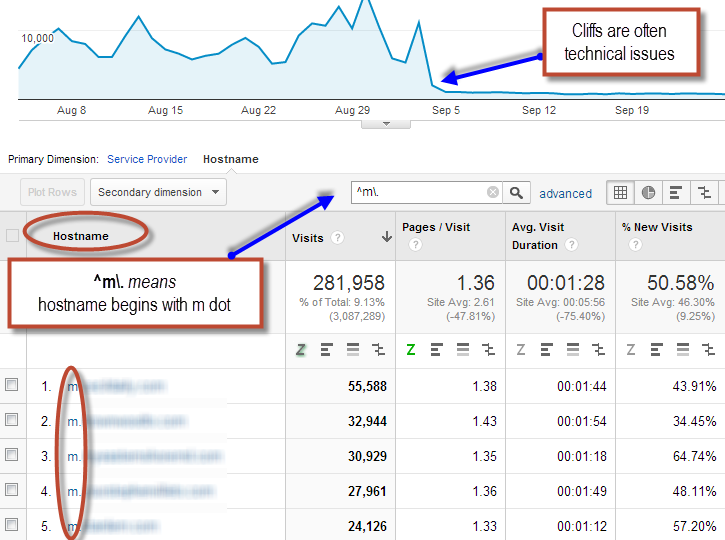
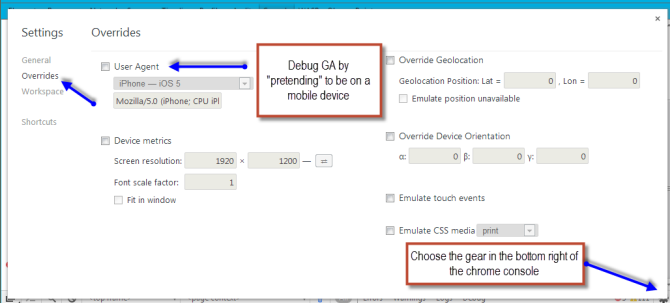
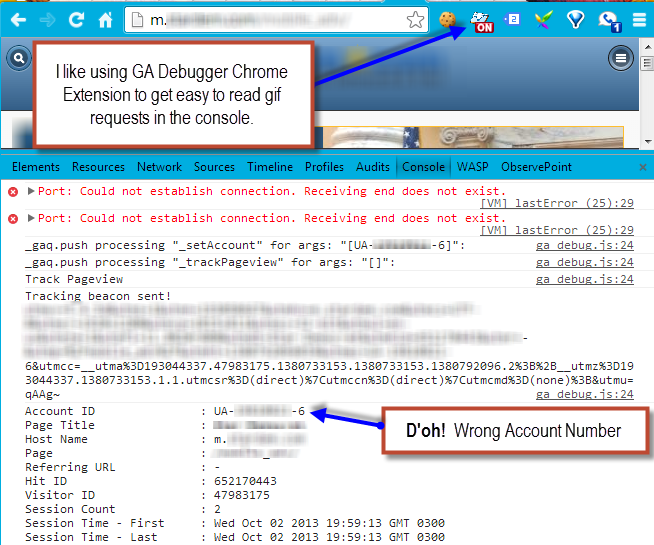
The next step is to look at the actual gif requests coming from the mobile site. When debugging mobile, my method is to override my user agent using the developer tools in Chrome. (In this case, I could have also just entered the m. subdomain into the browser).
As you can see from the gif request, I discovered that they dropped in the wrong tracking code across a wide number of mobile sites. This publisher didn’t have a traffic problem at all, it was a tracking problem.
Takeaway #5: Use Google Tag Manager so it is easy to keep track of all of your different tags.


Good sleuthing – you’ve done a really good job explaining how it takes a few tools (& skillsets) to correctly find root cause of analytics issues.
Keep it coming.
Great post, sir. I’m actually in the process of dissecting a similar issue. I implemented GTM on our site last week, and GA traffic seemed to drop off a gently sloped cliff. The weirdest part is that it wasn’t suddenly [http://screencast.com/t/uVoYYwGDY], and I’m not seeing any immediate patterns. So we went back to standard GA tags this week and traffic came back to to its previous levels. I’ve checked all the easy reports for anomalies, and I’m seeing increases in traffic on some important pages but decreases on many important ones. We also use HubSpot and I was going to add their tags to GTM, but I’m holding off until we get some info.
Have you seen something like that before? I know this is vague, but I’m going to keep looking. And if it’s something notable I’ll update.
@brandonashton:disqus
Look at cross browser reports and timing issues as they related to GTM. Sounds like a javascript hiccup to me somewhere in your implementation.
Hey Yehoshua, I wanted to reply since I ended up finding the issue. I started where you mentioned with cross browser reports, and the turned out to show proportional decreases across each browser. But what ended up being the issue is that we implemented two changes that day–the GTM tag and then also adding a tool that a lot of our homepage traffic uses. I thought I had accounted for it, but I missed an adjustment in my advanced segments and that in addition to the fact that apparently the tool gets used a lot more near the end of the week had me puzzled. But thanks for your help, and it’s another example of why testing one thing at a time makes troubleshooting a lot easier!
(And among other things, it shows how significant a portion of our homepage traffic is simply existing customers… I have work to do.)
Good Post ! Definitely put some light on this problem
This is super helpful! I used to use this method when I was identifying problems in my traffic. However, it’s pretty time consuming and I’m trying to build up my blog. For 5 bucks this guy does an analysis of my traffic spikes. It’s super helpful!
https://www.fiverr.com/jongaull/tell-you-why-your-website-traffic-dropped
Thank you, that was useful article, overview of the traffic drop reasons 🙂
This is an excellent article to ease my mind, and help me compare things better. I thought individual swings in traffic were more grave than they actually were, and after running through the comparisons and individual channels, I can see exactly what happened.
Thanks!
thank you this was useful article
Thank you, It helps a lot to find reason of my website traffic dip, Keep Going 😉
Great article, thanks for the advice and tips.
Nice article, even my site is experiencing decrease in traffic from social media and other aspects. Keyword ranking is falling, searched a lot in internet how to pin point the issue.
My site goo.gl/JsAlwm is recently falling traffic.
Just found the right place to learn the thing.
Good work, keep on moving..