A better way to measure content engagement with Google Analytics
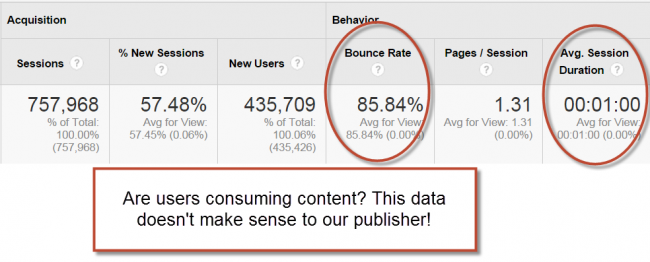
This post is inspired by a conversation that I had with my friend and colleague Simo Ahava at Superweek as well as a recent work request from a well-established Italian publisher. In short, the publisher was quite challenged by the fact that they had an 85% bounce rate, and that their time on site was so low. Their articles tend to the get many hundreds, if not thousands, of Facebook likes, so “how could it be that users were spending so little time on site?!” Their average time on page was around the three minute mark, so how could be that average session duration was significantly lower?
- Challenge 1: Google Analytics tracks time on page / on site by measuring difference between time stamps of hits. If the page is a bounce, no time will be recorded.
- Challenge 2: Even if the page viewed is not the bounce/exit page (and thereby has a time greater than zero), GA doesn’t distinguish between time on page/site if the browser window is in a hidden or visible tab
After a lengthy explanation to the client informing them of the way the Google Analytics tracks time on page (and by extension, time on site), they were still stuck without a way to accurately measure content engagement. First of all, there are a number of different ways to measure engagement besides time on page / site. Many posts have been written about this and I urge readers to seek those out since time metrics gain too much undue focus as it is. As things stand, since this publisher’s site was not configured with any event tracking (a scroll tracking module would be great), they were seeing many users come to their site, view one page, and then leave. Unfortunately for them, “out of the box GA” does not provide very good insights into the nature of how users are interacting with their content. “Are they even reading the content?”
In my time out there on the interwebs, I have heard many folks voice concerns, complain, groan, or otherwise kvetch about Google Analytics not providing them with accurate time on page. Of course, even the out of the box time on page metrics for non-bounce visits still skew the picture we want to paint of user behavior. In particular, I think about how often it is that I right click on a link on Twitter or elsewhere, and open that link in a new tab. From the moment the tab is open, the clock is running. In an even more common scenario, I have multiple tabs open and forget about those pages for some time only to go back to them later. From a time on page perspective in Google Analytics, the clock is running (until session timeout at 30 min default). In most cases, the total time on page isn’t even recorded because users close their browser window or the session times out. So when I heard Simo speak about the Page Visibility API at Superweek, I got to thinking about how we could model true time on page in Google Analytics.
There are few major considerations that I have when trying to understand “real” time on page. I’m defining “real” time on page as the amount of time that the window has been in focus. So, first question to answer is –> “is the window in focus?” (I.E. is it the current tab in the browser). Next, we’ll need to get a timestamp for when the user navigates away from the page or closes their browser window. Thanks again to Simo for shooting me over a code sample for the beforeunload function. (Simo, if you haven’t figured it out already, I think you rule!)

The first place I am modeling this data within Google Analytics is using the User Timings API. Much like event tracking, user timings use categories, variables, and labels. The value is time in milliseconds (converted to seconds in reports). I really like using the User Timings API because it is GA’s native way to track events that have to do with time in GA. Strangely, I find it to be a highly underused feature of Google Analytics.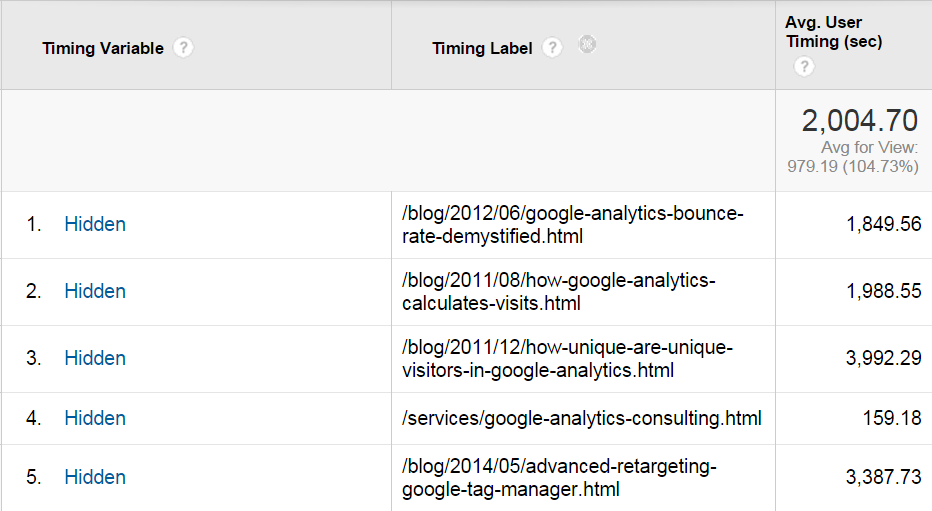
The logic works like this.
When the page loads, GTM sets a time stamp and we record the page’s Visibility State. Using an event listener, when the visibility state changes we fire a timing tag. The Category is “Page Visibility”, the Variable (think GA Event Action) is Visible or Hidden, and the value is calculated by subtracting the previous time stamp from the current time stamp. The value pushed into the data layer needs to be the opposite of the current visibility state. That is because we need to set the value for the hit to be descriptive of the previous state. For example, if my tab is Hidden and then becomes Visible, I’ll need to push a data layer value into my tag at the moment that it becomes Visible informing GA of the amount of time the tag was Hidden.
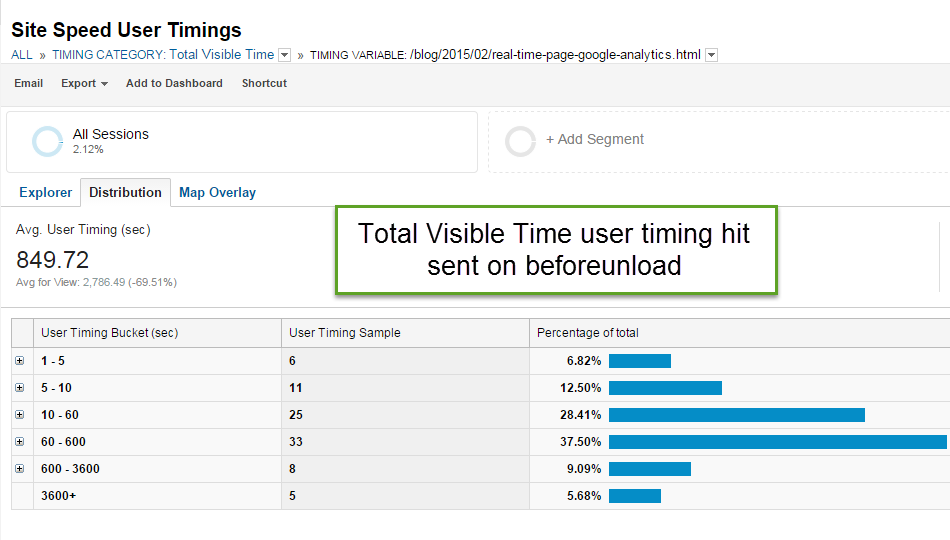
One of the things I’m like most about using the User Timings API, is the ability to get a histogram of the timing samples. Below we see the average amount of time that browser tabs were hidden for articles on this site. For every timing hit sent to Google Analytics via the User Timings API (in our case, the amount of time the window was not in focus), the data will find its place within the distribution. This shows me approximately how long users are not looking at my content, even though the “clock is running” in terms of the standard time on page metric (or not captured at all in the case of a bounce).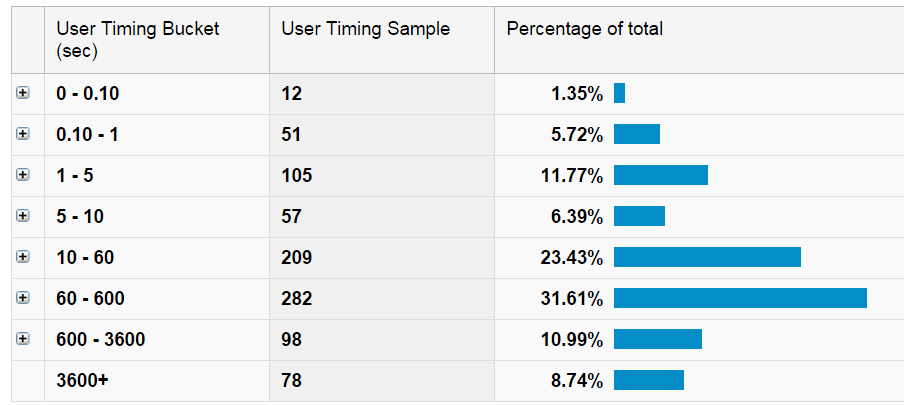
In this implementation, we fire a user timing hit for every change in browser visibility state. Critically, we also make sure to send an timing hit immediately before the browser window closes. In order to help make sure that the data gets to Google before the browser window closes or navigates to the next page, we employed the useBeacon feature of the analytics.js API.
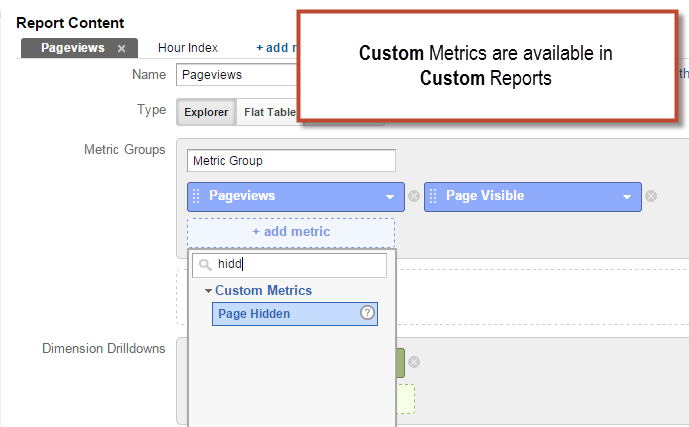
The User Timing API measure the amount of every hit, but I also want to collect raw aggregate timing measures. In order to calculate the amount of time that page was in focus (on average), I decided to leverage Custom Metrics. When custom metrics were first released, I admit that I did not see them as having much utility. Although I still wish that those metrics could be scoped to session and user levels (pretty please?), I have found more and more use cases where custom metrics are useful. Pro tip: Think about meaningful ways to use Custom Metrics in your implementations.
One thing you should know about custom metrics is that they increment per hit. They are counters. So, for every timestamp that I send to Google for my page being in focus, it will be added up on the page level. There are three types of custom metrics: integers, currency, and time. The time metric also needs to be sent as an integer (no decimals allowed!).
The data I’m looking for is the average amount of time the page was visible or hidden. Within the standard GA reports, the custom metric will return TOTAL visible time or hidden time. I needed to export the data to Excel and do some ETL in order to calculate the average visible time per page (Total Time / Pageviews).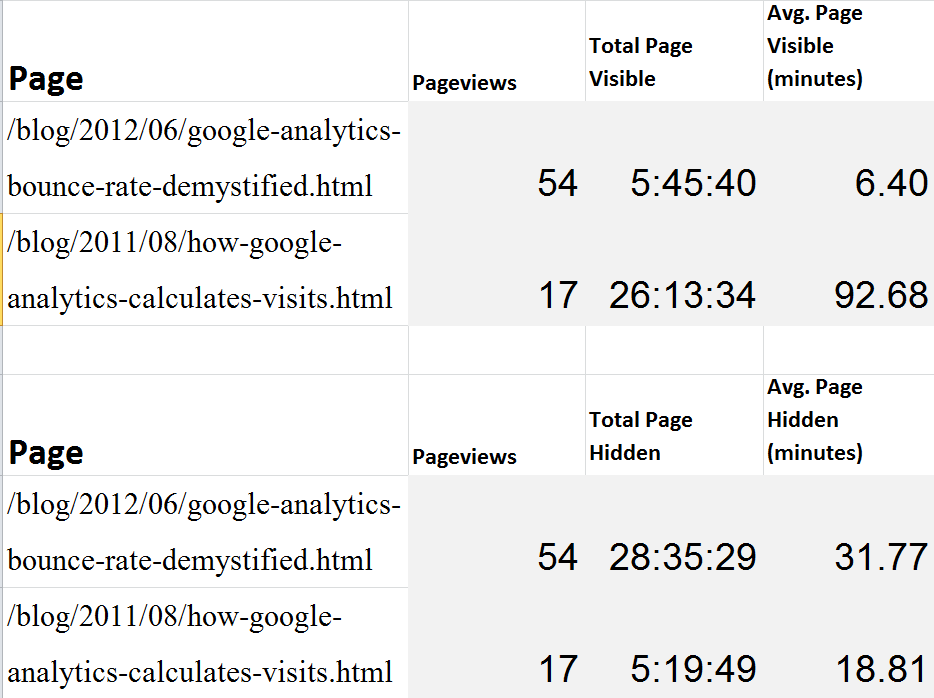
Depending on your implementation needs, you may want to set an upper limit within the Google Analytics backend for the value of the custom metric. Just think about the number of times you’ve gone to sleep and left your browser window open. 🙂 For starters, I suggest trying a 1,800 limit to the value for the metric, as this will map to the standard session timeout in Google Analytics. As you evaluate your own needs, you may want to experiment with this (would love to hear more in the comments below). The above image did not have the custom metric upper limit applied.
UPDATE #1: A number of people have been asking for some data that shows bounced vs. non-bounced sessions as they relate to the Total Time Visible metric.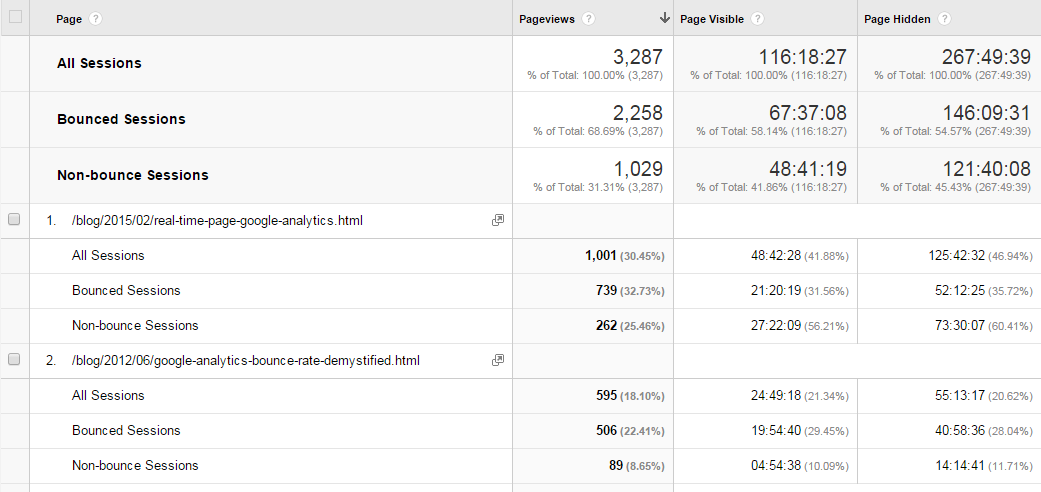
UPDATE #2: Because averages suck, I’ve also started sending a “Total Time Visible” value to User Timings on the beforeunload. This value is calculated by looping through the array of data layer values for when the page was visible and summing them. (Go Math!).
Personally, I love the histogram feature within GA that is available in far too few reports.
Summary: A better understanding of true user engagement with their content can help the publisher mentioned in the beginning of the article understand which types of content build user loyalty (and by extension pageviews, and by extension advertising revenue). In summary, we started with a real business use case where a publisher was feeling the pain of not having visibility into user engagement with their site. A technical solution (which gratefully relied on the expertise of some really smart people) was able to come into existence to in response to the problem. That’s my general approach to digital analytics. Let your strategic business objectives and questions drive the data collection solution which can then be used to make smart decisions.

This is just so awesome, for a number of reasons.
First, you mention me in a number of places which inflates my already gargantuan ego.
Second, you combine a number of really cool APIs to arrive at a solution for a very real business question.
Third, this solution will *only get better* once visibility API and the sendBeacon support extend to more and more browser versions out there PLUS once we, at some point hopefully, get calculated custom metrics. With calculated metrics, you’d then be able to create the column for Time on site / Pageviews right in the UI.
Fourth, I can now focus just on the technical implementation in my own blog post and just refer to this one for the business insight 🙂
Some ideas for analysis: Choose “Bounced Sessions” as the segment and voila! You have aggregated time on page for all sessions that bounced.
Also, I wonder would it work if you choose Exit Page Path as the dimension and choose the custom metrics? This would reveal exit page time as well, which is, in addition to bounced sessions, a void in GA’s default calculations.
Awesome blog post! @simoahava:disqus You mention the technical implementation in your own blog post. This is exactly what I need now. Unfortunately I haven’t found anything on your blog 🙂
Nice work Yehoshua and Simo, love it! It’s always frustrating for businesses when you need to explain the limitations off time-on-site and bouncerate. This solution will be very welcome to many of them.
Two questions for my own understanding:
1) Did you compare the standard GA measurement of time-on-page with your custom set up (for a non-bounce/non-exit pagevisit)?
2) In the beginning you give “opening multiple tabs from Twitter” as an example. I do this too, but on news websites. You scroll through the front page and open every article that seems interesting in another tab. Afterwards, you start reading all these articles one-by-one. How would this behavior be measured in GA traditional setup and your setup?
I assume in the traditional setup: Multiple direct sessions (one for each tab that I opened) that all result in a bounce and an average time-on-site of 0. Right?
Hi Jente,
1). I hope to update the blog post with an answer to number one as soon as I can.
2). Opening new tabs does not mean new sessions. As long as the tabs and subsequent pageviews are with in the same session window (30 minutes), you will have subsequent pageviews that are sequential. So even though you didn’t view the content, GA will consider it a session with multiple pageviews.
The implementation suggestions in this blog post will allow you to view the in focus time for each of those pages.
Ok, thanks for the clarification! Looking forward to your update on number one 😉
Great post Yehoshua. I’m not in the eccommerce arena so mainly deal with sites that are content heavy (read policy/ read guidance) so can see the benefit of this. Luckily we do implement scroll tracking so metrics not quite as bad as the example, but one we will deploy and advice others to do so too.
I am glad that you found the most useful, Dominic.
Great Post! I am currently a graduate student who is taking a class on web metrics and SEO, and have found the level of expertise and specificity really helpful. Thank you taking a specific topic and going into detail.
Thank you, Sarah!
Terrific post! I love discussions about bounce rate and content engagement. The standard bounce rate isn’t one of my favourite metrics as well. 😉
Wrote a couple of posts about adjusted bounce rate measurements in the last months. A topic close to this post. It’s incredible how many new insights you can derive by finetuning your implementation with extra measurements.
Btw, you are just added to my good old top Google Analytics blog list.
Check it out: http://online-metrics.com/google-analytics-blogs/.
You’re on the number #1 spot (in alphabetical order). 🙂
Wow. Thank you, Paul. I am honored.
That’s Just great!! We were approaching the concept of soft-medium-hard bounce with clicktale , but that’s a whole new l3v3l””
Awesome job Yehoshua
Giorgio Suighi
Thank you, Giorgio. Much appreciated.
Hi,
First of all good looking site!
Good luck with your site.
Are you looking for a life partner?
Please check out my website muslim marriage online
with kind regards,
Thanks much Yehoshua, Great post
I’m resurrecting an old post, but Google got me here, so I think it’s still relevant: people might want to take a look at Riveted, Scroll Depth & Screentime plugins by Rob Flaherty, which address this very issue. See http://riveted.parsnip.io/.
Hi there Ninjas!
That’s one very good post. I’m glad I found it. Like most people writing in the comments I have a question though. I really really hope you can answer it.
At the moment I’m hard at work on a (fantastic IMHO) Google Analytics integration plugin for WordPress. One of the functions it will have will be measuring the real time on page.
At the moment it works like this:
– GA tag doesn’t fire until the browser tab gets focus
– When it does, a timer counter starts
– Whenever a person switches tabs, the timer is paused
– Every 20 seconds, a function attached to a timer checks the position of mouse coursor and window scroll. If they didn’t change from the last time, the timer is paused
– When the user closes the tab, the beforeunload function is triggered and sends to GA… and here’s my question. What should I send to GA?
If I send an interactive event, than no pages will ever be tagged as “bounced”. If I send a non-interactive event, than the “time on page” won’t be updated in reports.
At the moment I think the best way to do it would be via a custom “Time on page” dimension with custom metric hooked up to it. However then I will get an agregate number, that will need to be divided with calculated metrics. It sounds fine, but it may be too much to ask my plugin’s users to set up.
What do you think?
I think that a Custom Metric is best. Needing to set up a calculated metric isn’t a terribly huge ask.
Hello. I encountered a strange problem for the https:webayandeh.com SEO training site. Low click-through rate and high impression, but the retention time on the page as well as the situation in the head is very good.
Do you think this can be a serious problem or just normal?
Thanks
Mehdi Saravani