One of the most common needs that have come up for Analytics Ninja’s clients in 2019 has been measuring page speed. The marketing industry seems to be very heavily focused on the topic with a wide range of articles and presentations at conferences focusing on the need for a fast site. There is a widely held belief, supported by numerous studies, that having a fast site will put your business on the fast track to making money.
I plan to write a follow up to this blog post exploring to what extent page speed impacts business success based upon our own client data. But before you can get to a place where you’re able to answer, “does page load speed matter, and if so, how much?”, we first need to have the capability to measure page load speed effectively.
Inspiration and Initial Thoughts
First of all, most readers of this blog already know that Google Analytics has a whole set of Site Speed metrics. So you may be asking yourself, “why is that not sufficient?”
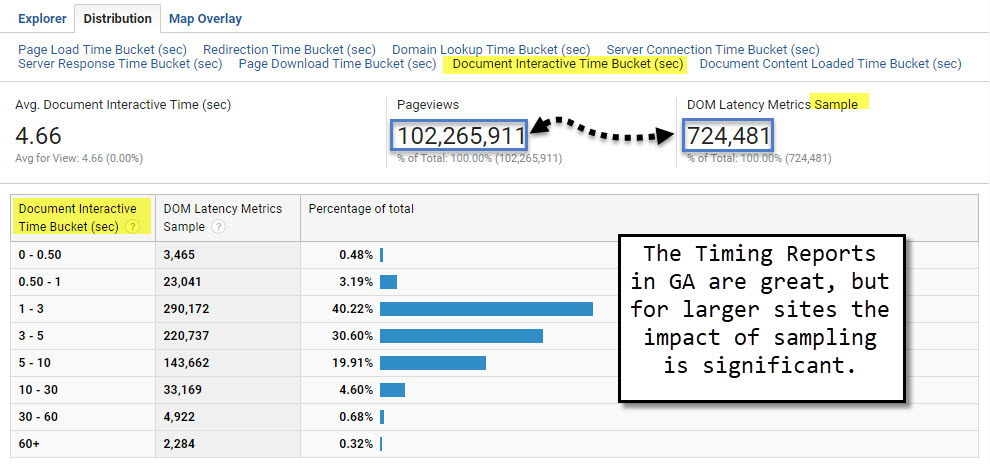
The main reason is because Google Analytics samples page timing hits to a default of 1% of all pageviews. This can be increased to 100% via a small change in code (setting siteSpeedSampleRate to 100%), but GA still limits the processing of the timing hits to approximately 10,000 per day. That means that for medium to large sites, there is a pretty significant data sampling that is happening on your page load metrics.
This issue has been addressed by members of the digital analytics community over the years. Andre Scholten (2011), Simo Ahava (2013), Joe Christopher (2017).
However, there were two posts that really caught my attention that have served as inspiration for client based work that I’m going to share in this article, namely Dan Wilkerson’s 2016 post on increasing GA Page Speed Hit Limit and Jenn Kunz’s 2019 post about improving Adobe’s performanceTiming plugin.
So what’s the deal with page load time?
One of the big mistakes that I’ve seen many people make is that they focus on a metric called “Page Load Time” to evaluate how long it takes a page to load. Based upon the metric’s name, and amplified by the fact that “Avg. Page Load Time” is the default page speed measurement metric in Google Analytics, I totally understand why someone would come to the conclusion that this default metric is THE one to use when describing page load speed.
However, when we want to describe the impact of page load on user experience, the picture (and related measures) becomes much more complex and nuanced.
Enter the browser’s Performance Timing API.
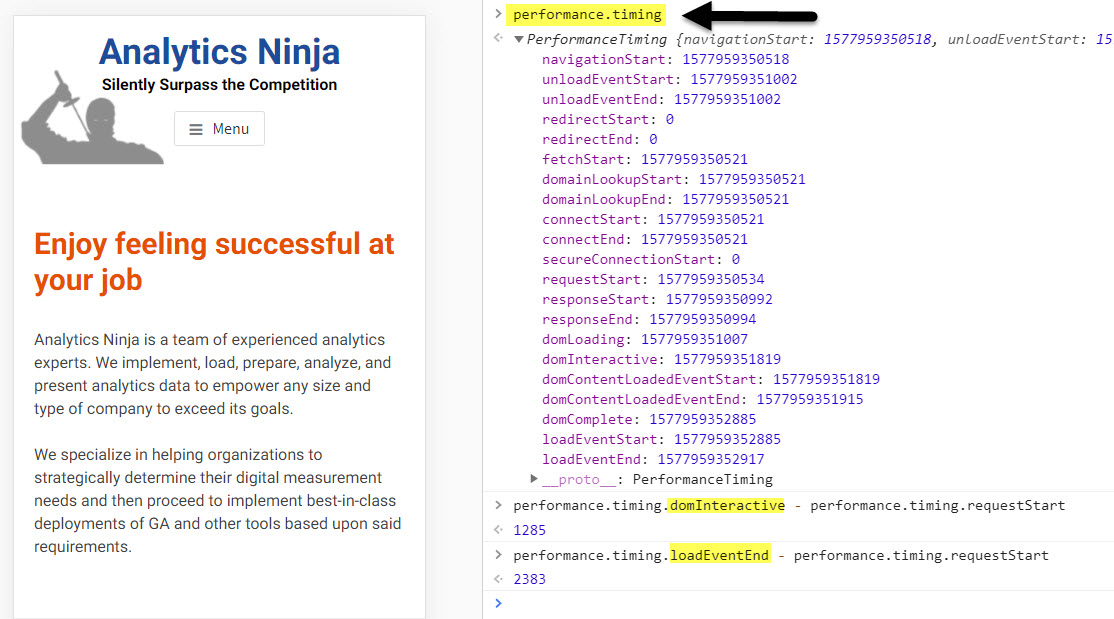
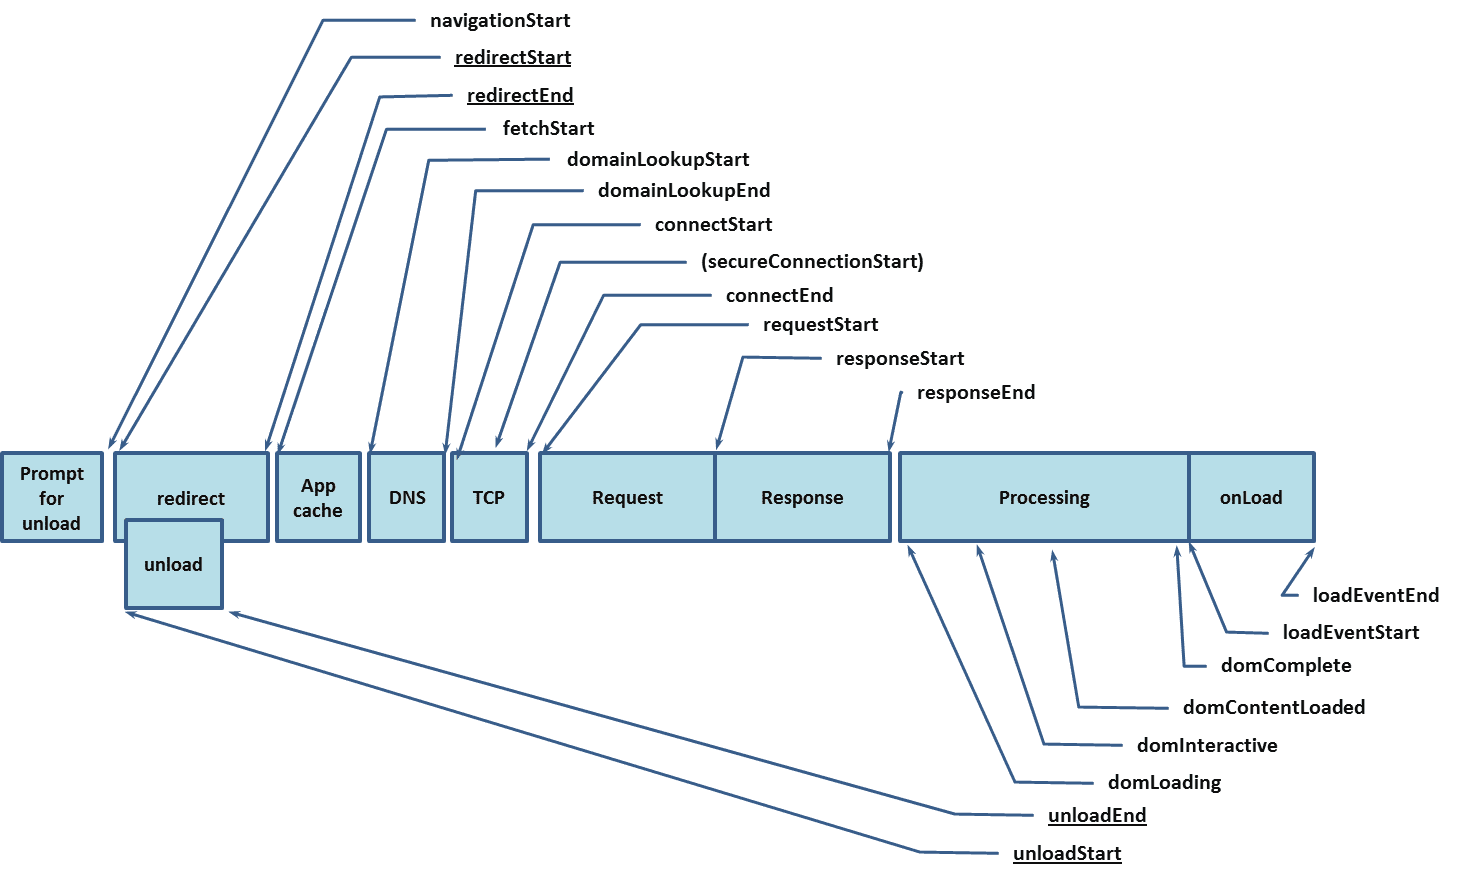 The Performance Timing API allows you to access a very large amount of information with regards to exactly how long it takes for basically everything in the page load process to happen. For the unfamiliar readers out there, you can see the values that are returned by the API in the browser by typing performance.timing into your browser console.
You’ll notice that each value returned is measured as a unix timestamp. These values are tremendously useful as they allow you to calculate the amount of time it took for the browser to reach each stage of page render. Since the majority of Analytics Ninja’s clients are using Google Analytics, we use custom metrics to capture timing values.
- Time to DOM Interactive
- domInteractive [minus] responseStart
- Time to DOM Complete
- domComplete [minus] responseStart
- Page Render Time
- domComplete [minus] domLoading
- Total Page Load Time
- loadEventEnd [minus] navigationStart
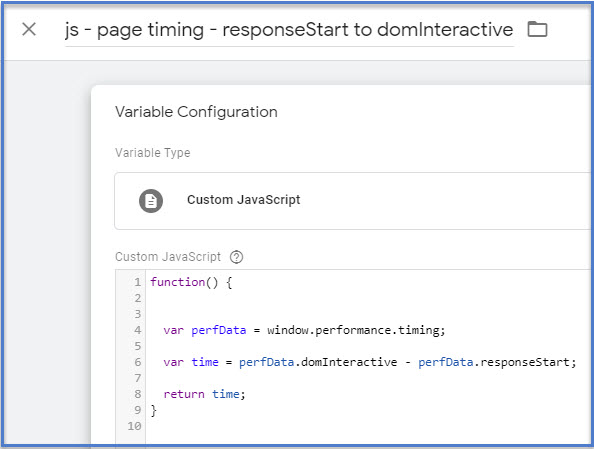
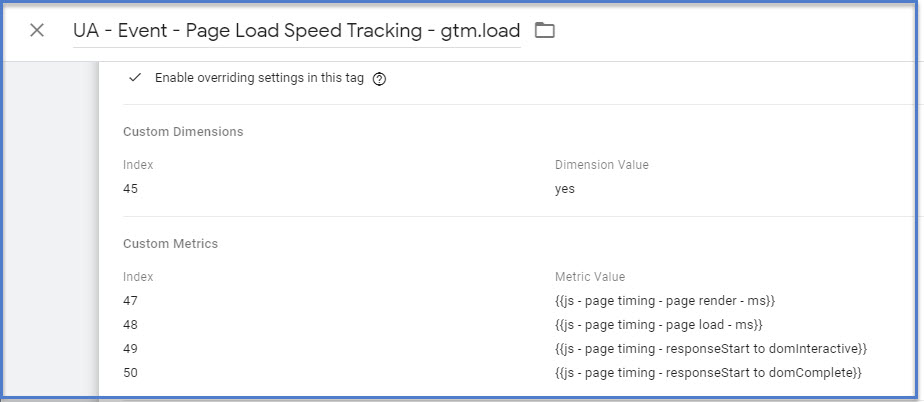
Sending the values to Google Analytics is quite simple via GTM. Simply create a tag that fires a non-interactive event on every gtm.load event (or a subset of pages, if desired) including the calculated values above as custom metrics. The variables you’ll use in GTM are custom javascript variables like the following example:
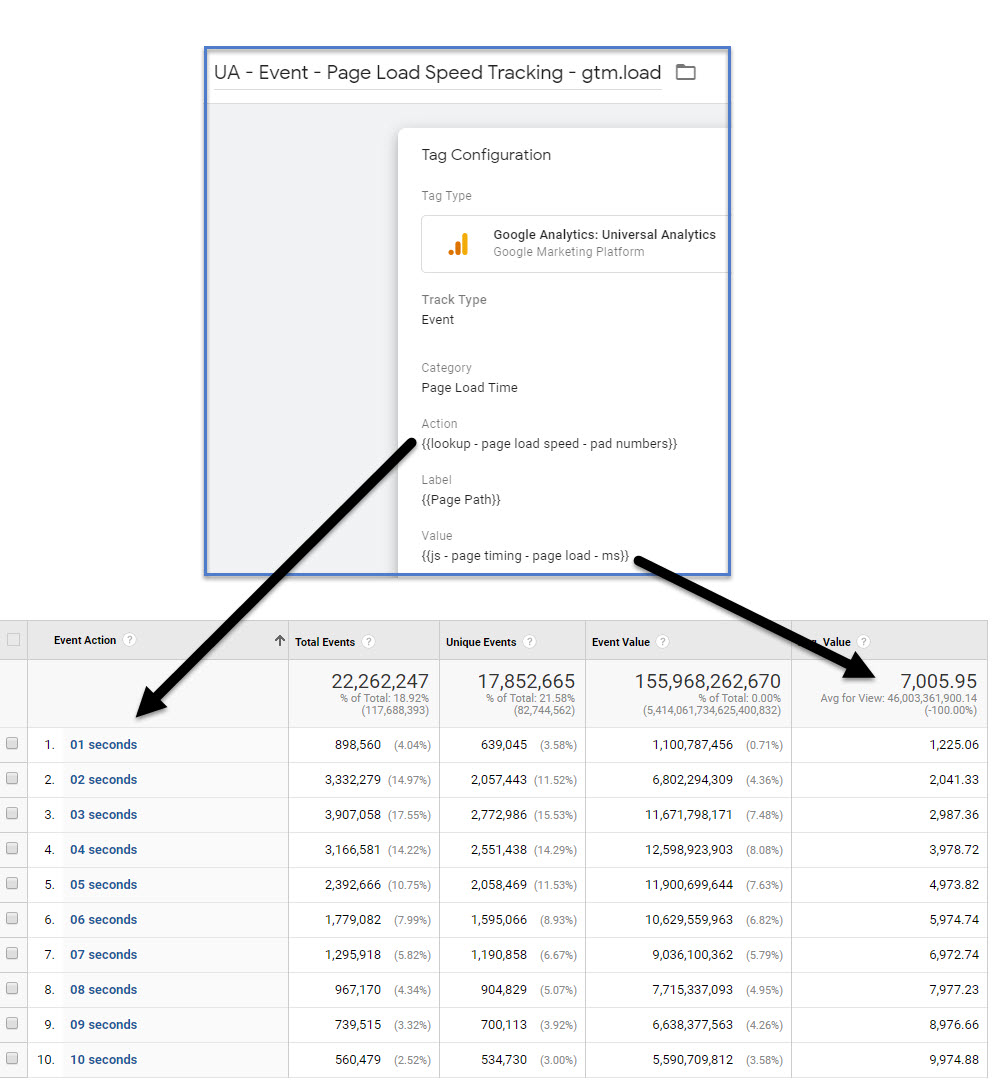
Also, the values provided to the Event Tag itself will provide useful data for analysis. (Again, credit to Dan whose inspiration lead to much of this post). I use a lookup table in GTM to map page load speed numbers to strings, which I pad with a leading zero so that alphanumeric sorting works within the GA user interface.
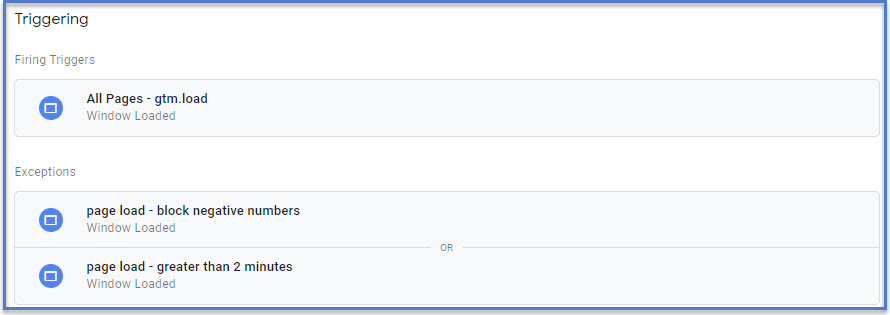
As far as the GTM triggers are concerned, you’ll need to fire this tag on gtm.load so that you all of the timing fields presenting in the performance.timing object. You need the page to have fully loaded before you can capture a value for the “Load End”. I also add two blocking triggers to the tag in order to maintain a bit of a cleaner data set; one that only allows positive numbers (someone smarter than me will hopefully and a blog comment below explaining how the amount of time captured in the browser could be negative) and the other that limits the upper bound for page load speed to 120,000 milliseconds so that outliers don’t completely wreck averages to the extent that we will averages in analysis.
Methodology
I’m going to explain a bit about the choices I’ve made with this current setup to hopefully answer some questions you might currently have.
Why not just use Google PageSpeed Insights for web performance? Why are you using GA?
The internet has quite a few tools for measuring page speed performance. Google in particular has been pushing the page speed agenda and offers numerous tools including Lighthouse and PageSpeed Insights. And yes, definitely use these tools to evaluate your page load speed. The data we are collecting in Google Analytics is not meant to be a replacement for such tools.
The two main benefits for collecting the data in GA is that Google Analytics
A). Provides REAL WORLD data from actual site users that help you understand their browsing experience. The ability to segment data by GeoLocation, Device Category (mobile/desktop), Browser and Browser version is extremely informative and actionable.
B). Allows you to correlate the impact of page load speed on a user’s browsing experience to their behavior.
Why are you using Events and not the native Page Timings report in GA?
As previously noted, Google Analytics limits data processing of timing hits to a maximum of 10,000 hits in a day. So, if your site has more than 10,000 pageviews per day you’re going to stuck in the sampling mud.
More importantly, when sending hit level data to Google Analytics, it enables you to extract hit level data from Google Analytics to do a lot more with the data than what is returned in the processed, aggregate reports (more on that later).
Why use the custom metrics? Isn’t Total Page Load Time as bucketed in the Event Action enough?
The reason I chose to use capture data such as Time to DOM Interactive (the point at which your browser will begin to respond to inputs such as scrolling, tapping ,or clicking) is because those metrics are much more indicative of actual user experience than the final Page Load event. In a followup post, I will share how I ran an A/B test on a site that improved average page load speed by about 25% (more than a 1 second improvement), but there was no impact on conversion rate which I attribute to the site’s Time to DOM Interactive not being significantly different between the Control and Variation in the test.
Are you concerned about sending so many hits to GA?
Yes, there is definitely a concern about the number of hits you send to GA. Keep in mind that this implementation will send an event for approximately every pageview. The biggest concern in my eyes is the 500 hit per session limit in GA. After 500 hits in a session, GA will simply stop processing any additional data for that session. Additionally, larger sites can easily exceed the 10M hits per property per month limit that is a part of free GA’s Terms of Service. (Practically speaking, it’s a soft limit. Currently, sites I’ve audited are not flagged until about 50M hits per month).
As such, I tend to push the data to a separate property and stitch it together later unless our client has GA360 (in which case hits per session limit can be increased to 2000/month and monthly hit limits are not much of an issue).
Reporting and Data Visualization
Below are some examples of reporting and data visualization that can be done with the Event Data.
Google Data Studio
The following report is something I created in Google Data Studio.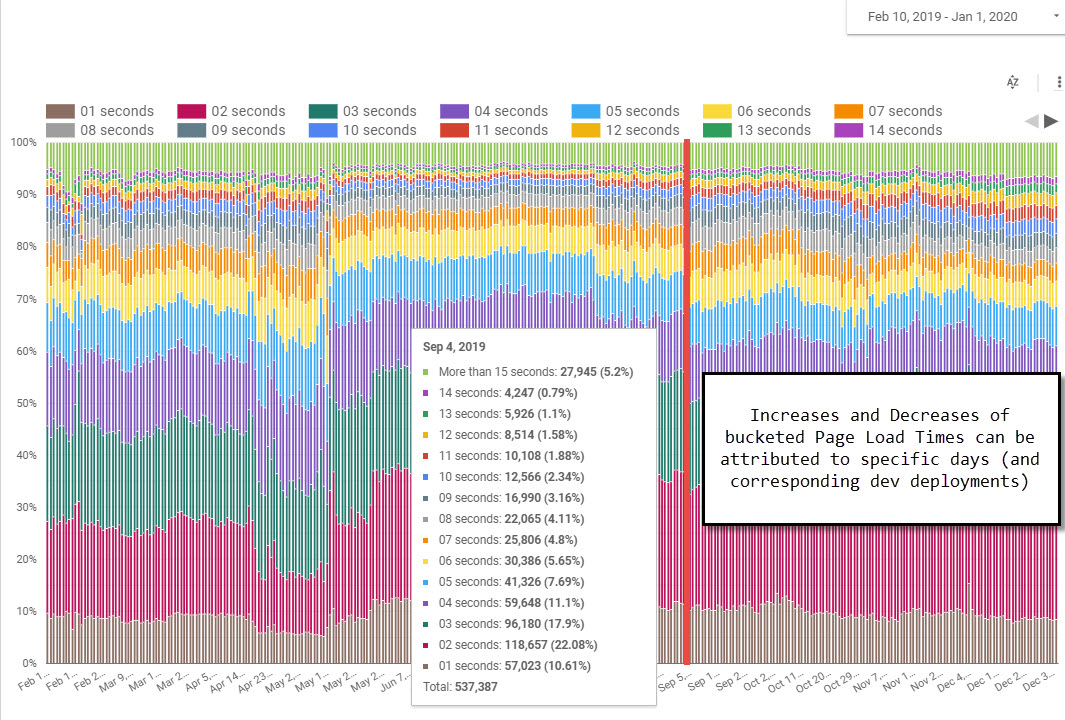
By using a 100% stacked bar chart, we can visualize how the distribution of page load speed changes over time. Mousing over a column can also be used to reveal the specific distribution and total sample size of data on a particular day. I’ve found that sharp changes to the trends tend to be associated with Dev Team site deployments which either improve or hurt page load speed.
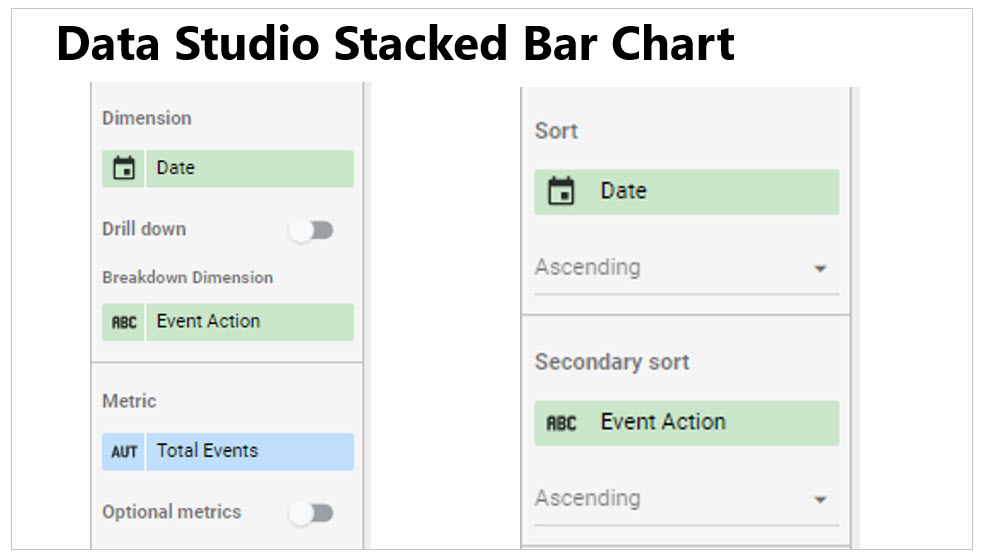
To create the report, choose a bar chart, set your dimension as Date, and your breakdown dimension as Event Action (which is where we have the bucketed values captured in the tag example above). Then set the Secondary Sort to Event Action (ascending) so that the bottom color is page loads that happened within 1 second, and the top color is page loads that happened in 15 or more seconds. As you hopefully recall, we padded the strings that get sent to the Event Action so that they can be sorted alphanumerically in this report.
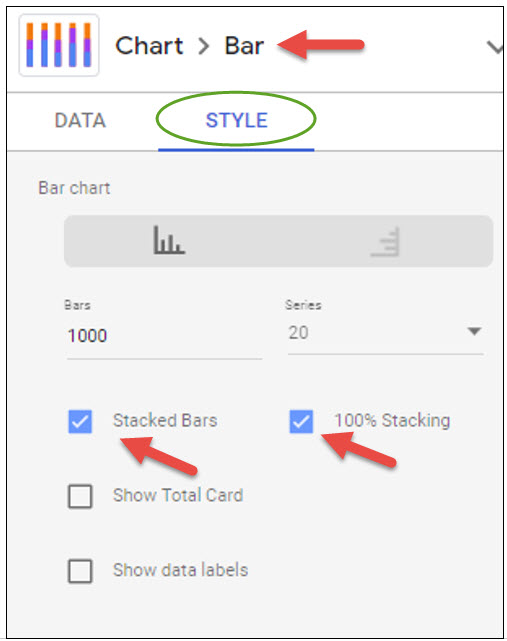
In the Chart Style settings, you’ll need to toggle on both Stacked Bars and 100% Stacking.
One of the things I like a lot about creating this report in Data Studio is the ease to which extent you can add additional layers of segmentation to this report. A filter control can easily be added as a slicer to allow you to slice and dice by any valid dimension.
Tableau
The limitation of the GA based above is that is in aggregate. Granted, the bucketing of Page Load Times does indeed lead to a very nice distribution and visualization in Data Studio example. But there is so much more that can be done if we use non-aggregated data. I am going to be using Tableau in the following examples to share some data visualizations that I like quite a lot.
Before we get jump into the data viz, I want to note that pulling non-aggregated data out of Google Analytics will require some prerequisite implementation work as well as using the Reporting API. On the implementation requirement side of things, you’ll need to be able to access an individual hit in GA. I do this by making sure that both the clientId and some form of a “hit ID” are available as Custom Dimensions. (I note that ga:clientId has recently been added to the Reporting API so it technically does not need to be stored as a Custom Dimension any longer as far as the Reporting API is concerned. However, at the time of this writing ga:clientId is not yet available via the Management API or within the GA User Interface. As such, I still recommend storing the clientId as Custom Dimension).
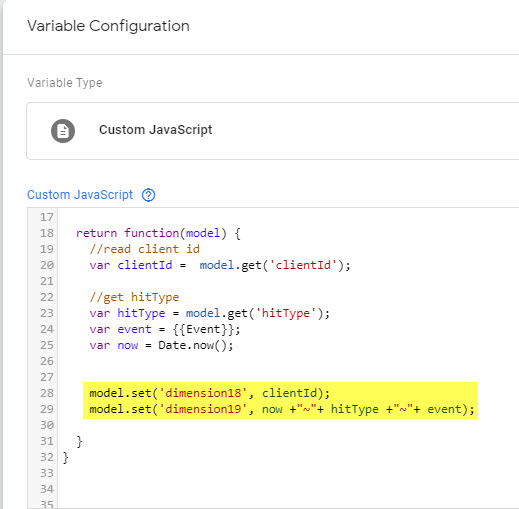
For our clients, we use a hit timestamp concatenated with the hit type and GTM event to create a unique identifier for each hit. When queried with the clientId, this will provide an individual row for each hit.
The values are setting using Custom Task to make sure that all values are available on all hits. If you’re unfamiliar with using Custom Tasks or how to code them, there is plaid shirted GTM legend named Simo Ahava who has written tomes about Custom Task. Read his stuff for everything you’ll need.
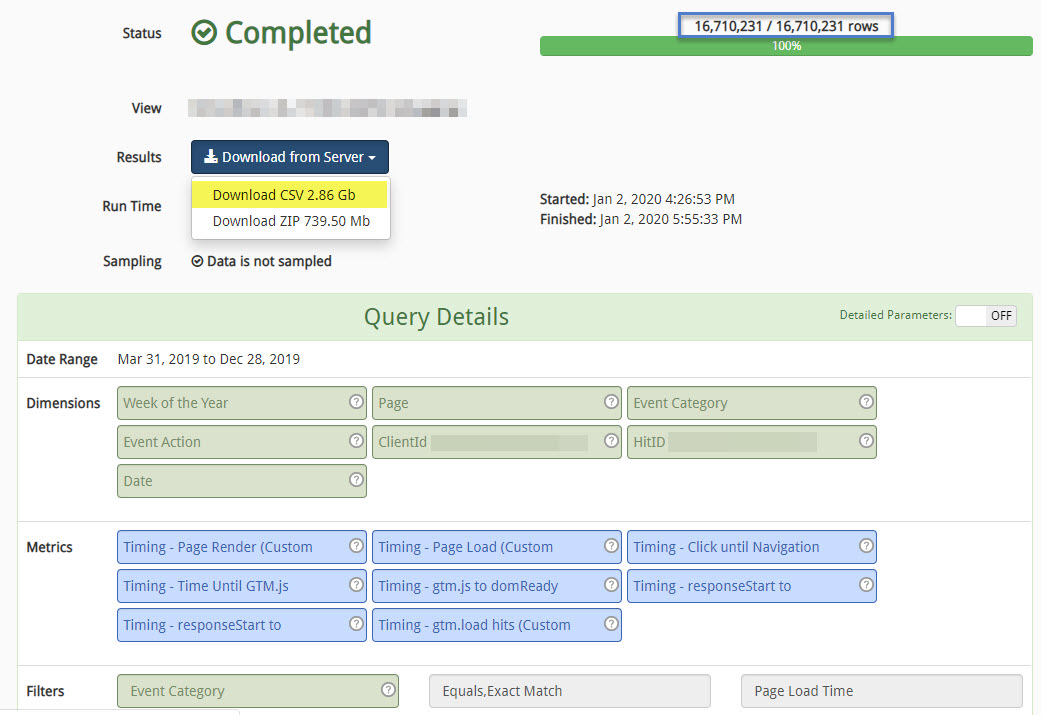
Do note that when pulling hit level data from GA, the data sets can be quite large. The millions of rows that I pulled from the API to make the reports I’m about to share below happen created Tableau data extracts around 2.5gb in size.
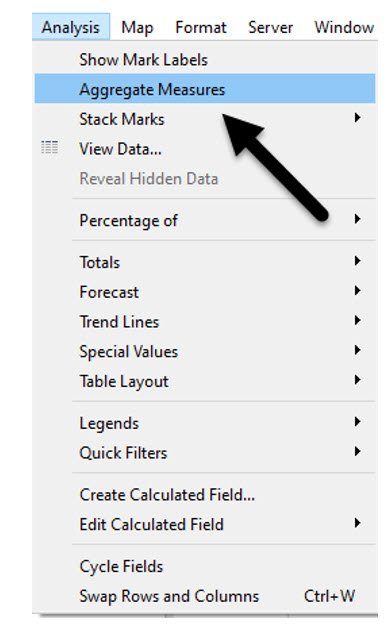
One of my favorite data visualizations to use in Tableau is the Box and Whiskers. The Box and Whiskers chart (also known as a Box Plot) creates a great distribution where you can see the median data value. (Learn the basics for how to interpret the data here and how to create one in Tableau here). It is important that you turn off Aggregate Measures in Tableau as you want each timing value to be represented in the data set.
The business question my team and I were tasked with answering was to what extent page load speed had changed over time and was influenced by Geography, as our client had a “feeling” that things were getting slower. In the following example, I set the columns in the report to be “Time to DOM Interactive” and Hits (i.e. sample size), and the Rows to “Week of the Year”.
The reason that I included the number of records / rows (i.e. sample size) as a separate metric is to provide context for the distribution. I find it important to have a sense of just how much data we’re talking about when trying to understand any distribution.
From the report above, we were able to see that while the median Time to DOM Interactive grew over time, more importantly the number of page loads with exceeding long times to DOM Interactive (the upper whisker) grew quite a lot.
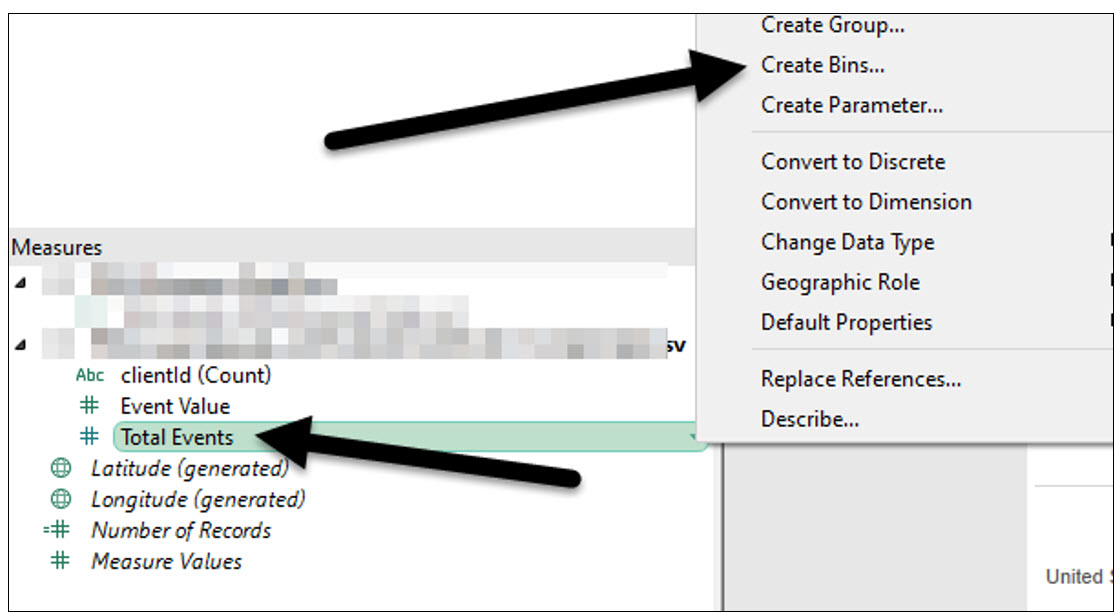
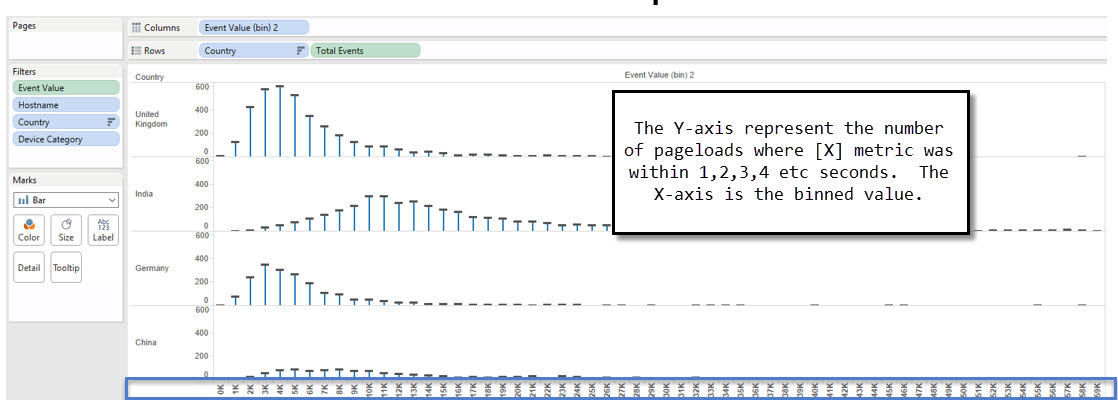
Another form of distribution that I found to be quite insightful was through the use of bins. Since every hit that was sent to GA contained a data point for each of the Performance Timing measures that we wished to collect, using bins can be applied to any of the metrics (Time to DOM Interactive, DOM Complete, Page Render etc).
Editors note: The bins you’ll want to create are for the Custom Metric values of Time to DOM Interactive etc (not total events as in Yehoshua’s lazy screen cap).
Using Country as a dimension breakdown, it is easy to see how different user locations impact their browsing experience on this particular site.
Wrapping Up
I am really pleased to have (finally) completed penning this blog post which has been sitting in draft mode for far too long. In addition to Page Load Speed being a particularly hot topic, both on the Web in general and for our clients in particular, diving into this data has been a particularly fulfilling experience for me. As a note of inspiration to myself and to those of you reading this post, much of what I’ve shared have been things that I’ve learned to do over the past 12 months.
One big takeaway that my experience exploring Page Speed data over the past year is that while aggregated data definitely has its place (creating the Data Studio report was relatively simple), you simply can’t beat the flexibility of working with non-aggregated data.
Next up, a post analyzing if page speed metrics correlate to business performance metrics.
Please feel free to leave comments below asking any questions or making suggestions for how to improve on some of the things that I’ve shared in the post.
~Yehoshua
.





Thank you for this. I’ve just implemented Simo Ahava 2016 method of doing this, so I’ll certainly be looking at implementing this as well
Thanks, Charles. I appreciate you taking the time to comment on this post. The biggest hurdle we’ve encountered is hit limits, so make sure to keep an eye on that if you’re sending data to the same property.
Hi Yehoshua,
Nice post and look forward to the next one on finding correl between load times and business metrics.
AFAIK, performance.timing var will only work for websites having a full round trip for each page load and not for Single Page Applications built in React, Angular. Probably have a separate post for such technologies as well. Thanks.
Holy cow, Yehoshua. What a great blog post – and I love the idea of sending the data to a second property. And that GDS report looks great.
A lot to unpack here. I read it on my phone; need to re-read this again tomorrow when I’m back in the office.
Great post. Thanks for your time and efforts explaining the whole daunting implementation and visualization process.
That aside, we spent a considerable amount of time on this specific topic, here are my thoughts and recommendations as well:
1- To overcome GA sampling, you may need to consider out-of-GA approach. Google cloud platform is a great solution to consider. We ended pushing hits into BQ using a combination of pub/sub and cloud functions.
2- if you have data layer in place, you can simply top up each hit you send to BQ with all kind of details you may need. Frankly, it was more than enough to us in 99% of the time.
3- waiting for gtm.load means you can’t capture incomplete cycles. For example, if the page is so slow and user closes the browser or tab before page is finished you’re done. And in my opinion, this is what we really want to measure. Hence, you may need to fire different events per each page cycle step (first byte, DOM load, Page Load).
4- the negative values is the doing of using back button in the browser. It took us ages to realize that LOL
Thanks Yehoshua and AN. This was incredibly useful and I hope to implement this soon. For me, the realization that this is necessary came when you mentioned the importance of knowing how page load speed could impact user behavior on our site and using REAL WORLD user experience on our site rather than solely making decisions based on a page load speed test from a developer.
Thank you for the detailed post! This is great, and I’ll be sure to use it. I especially think that the point of improving time to DOM interactive is often forgotten. My team has been struggling to communicate the value of higher page speed in a clear way. This will go a long way towards that!
Hi Yehoshua, thanks for sharing, love the idea and the Data Studio report is a nice touch. Thanks to this article I also stumbled across this little beauty: performance.getEntriesByType(‘paint’). Definitely going to add paint metrics for kicks 🙂
Amazing post man! I been working on page speed improvements on several larger omni retailers in the united states. Measuring page load time is always a struggle. This is exactly what I was looking for regards to accuracy and details. Companies often dont think about how much speed impacts their conversion, bounce and abandonment overall. Often they dont even realize that a majority of their customers are accessing their sites from slow mobile networks and they spend most of their time optimizing for broadband, thinking how well they are doing. I have seen companies tripled their revenue just by optimizing performance. This is what matters.